
Remittances to Pakistan
Are Benefits Paid in the UK Ending Up Abroad?

Paper outline
In this paper we examine trends in the benefits system broken down by nationality using Department for Work and Pensions (DWP) data.
In the course of this research, we began to examine whether certain attitudes or practices originating from parts of the Indian sub‑continent may have contributed to patterns of benefit system exploitation, including the transfer of UK‑paid benefits to countries such as Pakistan. This question is particularly relevant in communities where dual citizenship and strong transnational or tribal ties are common.
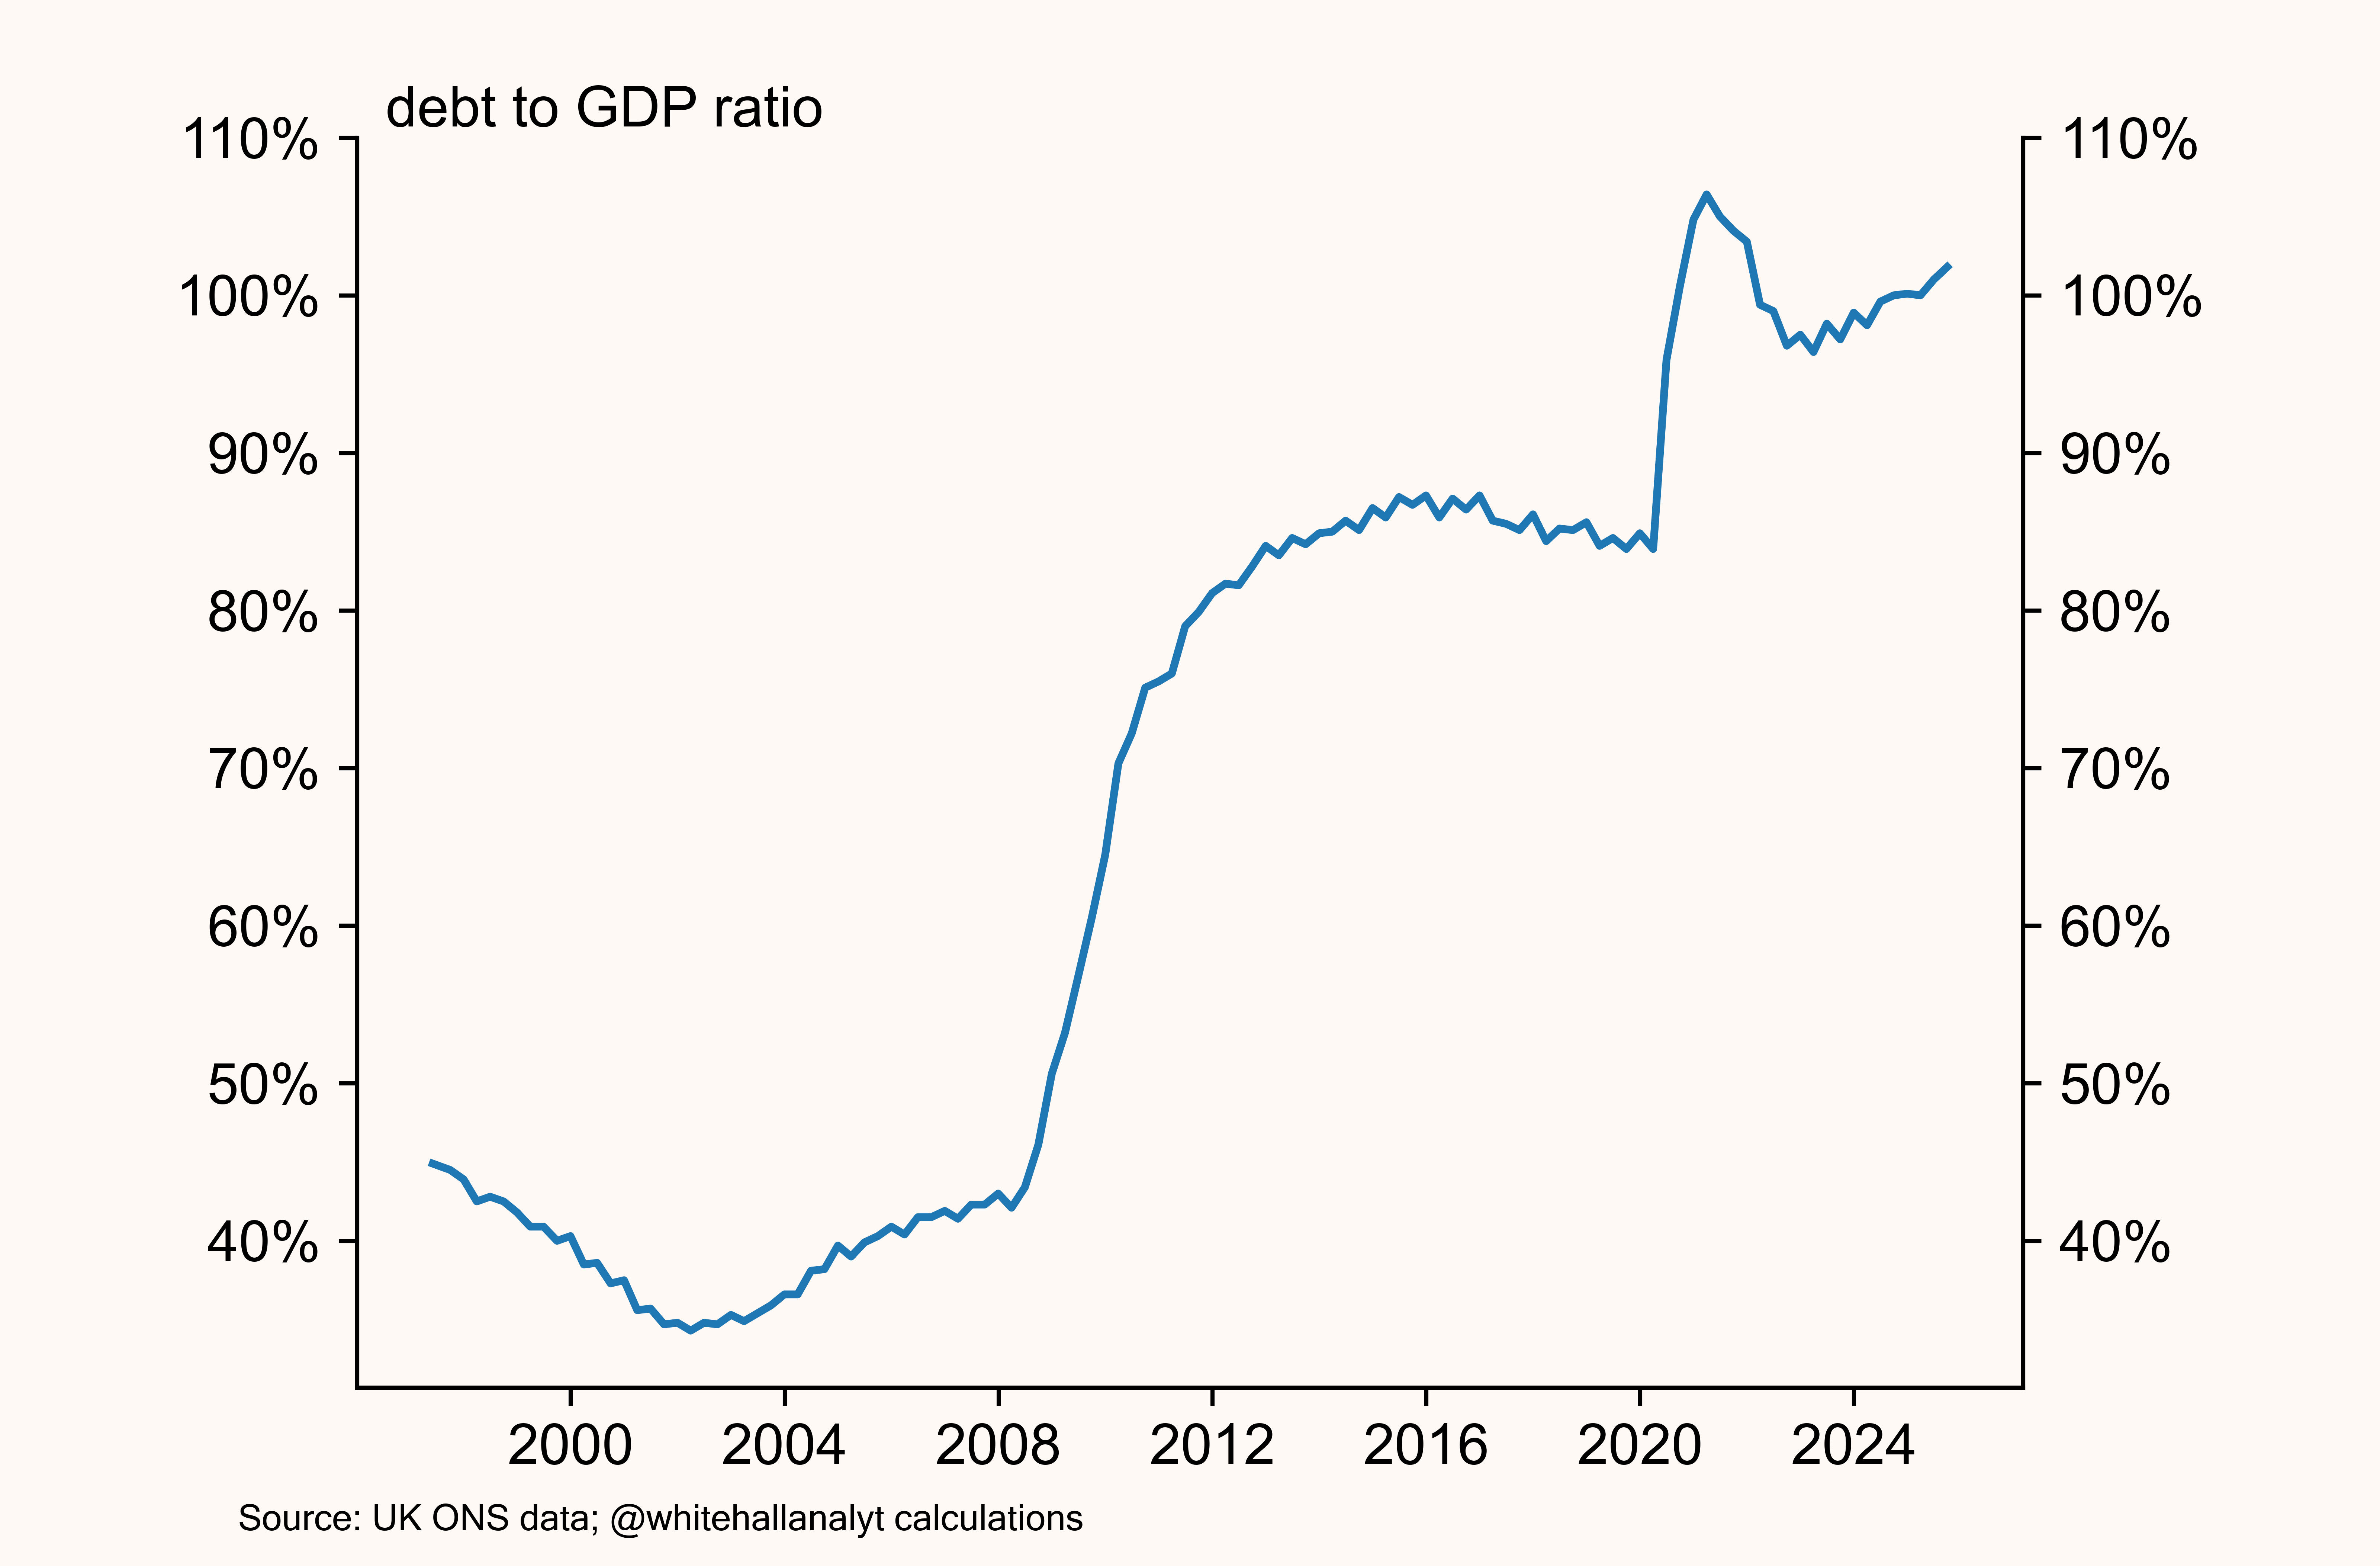
In 1997, our nominal debt‑to‑GDP ratio was 37%. It is now around 100% (see Exhibit 1), and this directly impacts the day‑to‑day lives of UK citizens, whether through increased taxes, national insurance hikes, or slowly decaying public services.
We are currently paying around £100 billion a year in debt interest. Around 45% of our GDP is consumed by the state, which is supported by an ever‑diminishing private sector. Worse still, the state provides additional supplementary support to the private sector through a creaking benefits system. Over six million people claim some form of benefit — from disability through to low income support. As real wage growth has stagnated, benefit income has become a viable alternative.
Exhibit 1: Gross consolidated debt as a percentage of Gross Domestic Product (’GDP’)
Whether in local councils or central government, a unsustainable culture of fiscal apathy has developed. Hot on the heels of the Blair‑era governments, a failed Conservative Party — terrified of being labelled “nasty” - allowed various excesses to become endemic.
As we imported cheap labour (and voters in the eyes of successive Labour governments) we also imported economic attitudes from the likes of Nigeria, Pakistan and Bangladesh into a Western democracy with a welfare state. Combined with increasingly sectarian local politics, expanding statutory obligations, and the ease with which decisions can be challenged through judicial review we argue ethno-religious attitudes have led to the exploitation of our public finances by certain communities.
A birds-eye view of benefits in the UK
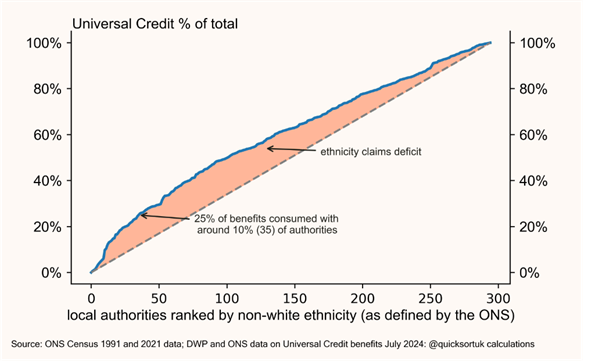
Exhibit 2 sets the scene by plotting the ethnic composition of each local authority—using the Office for National Statistics (ONS) ethnicity classifications —against the proportion of residents claiming Universal Credit. This provides a comparative view of how demographic characteristics align with welfare dependency across councils.
Exhibit 2: Universal Credit. Local councils ranked by ONS defined ethnicity (least ethnically diverse in blue and most in red)
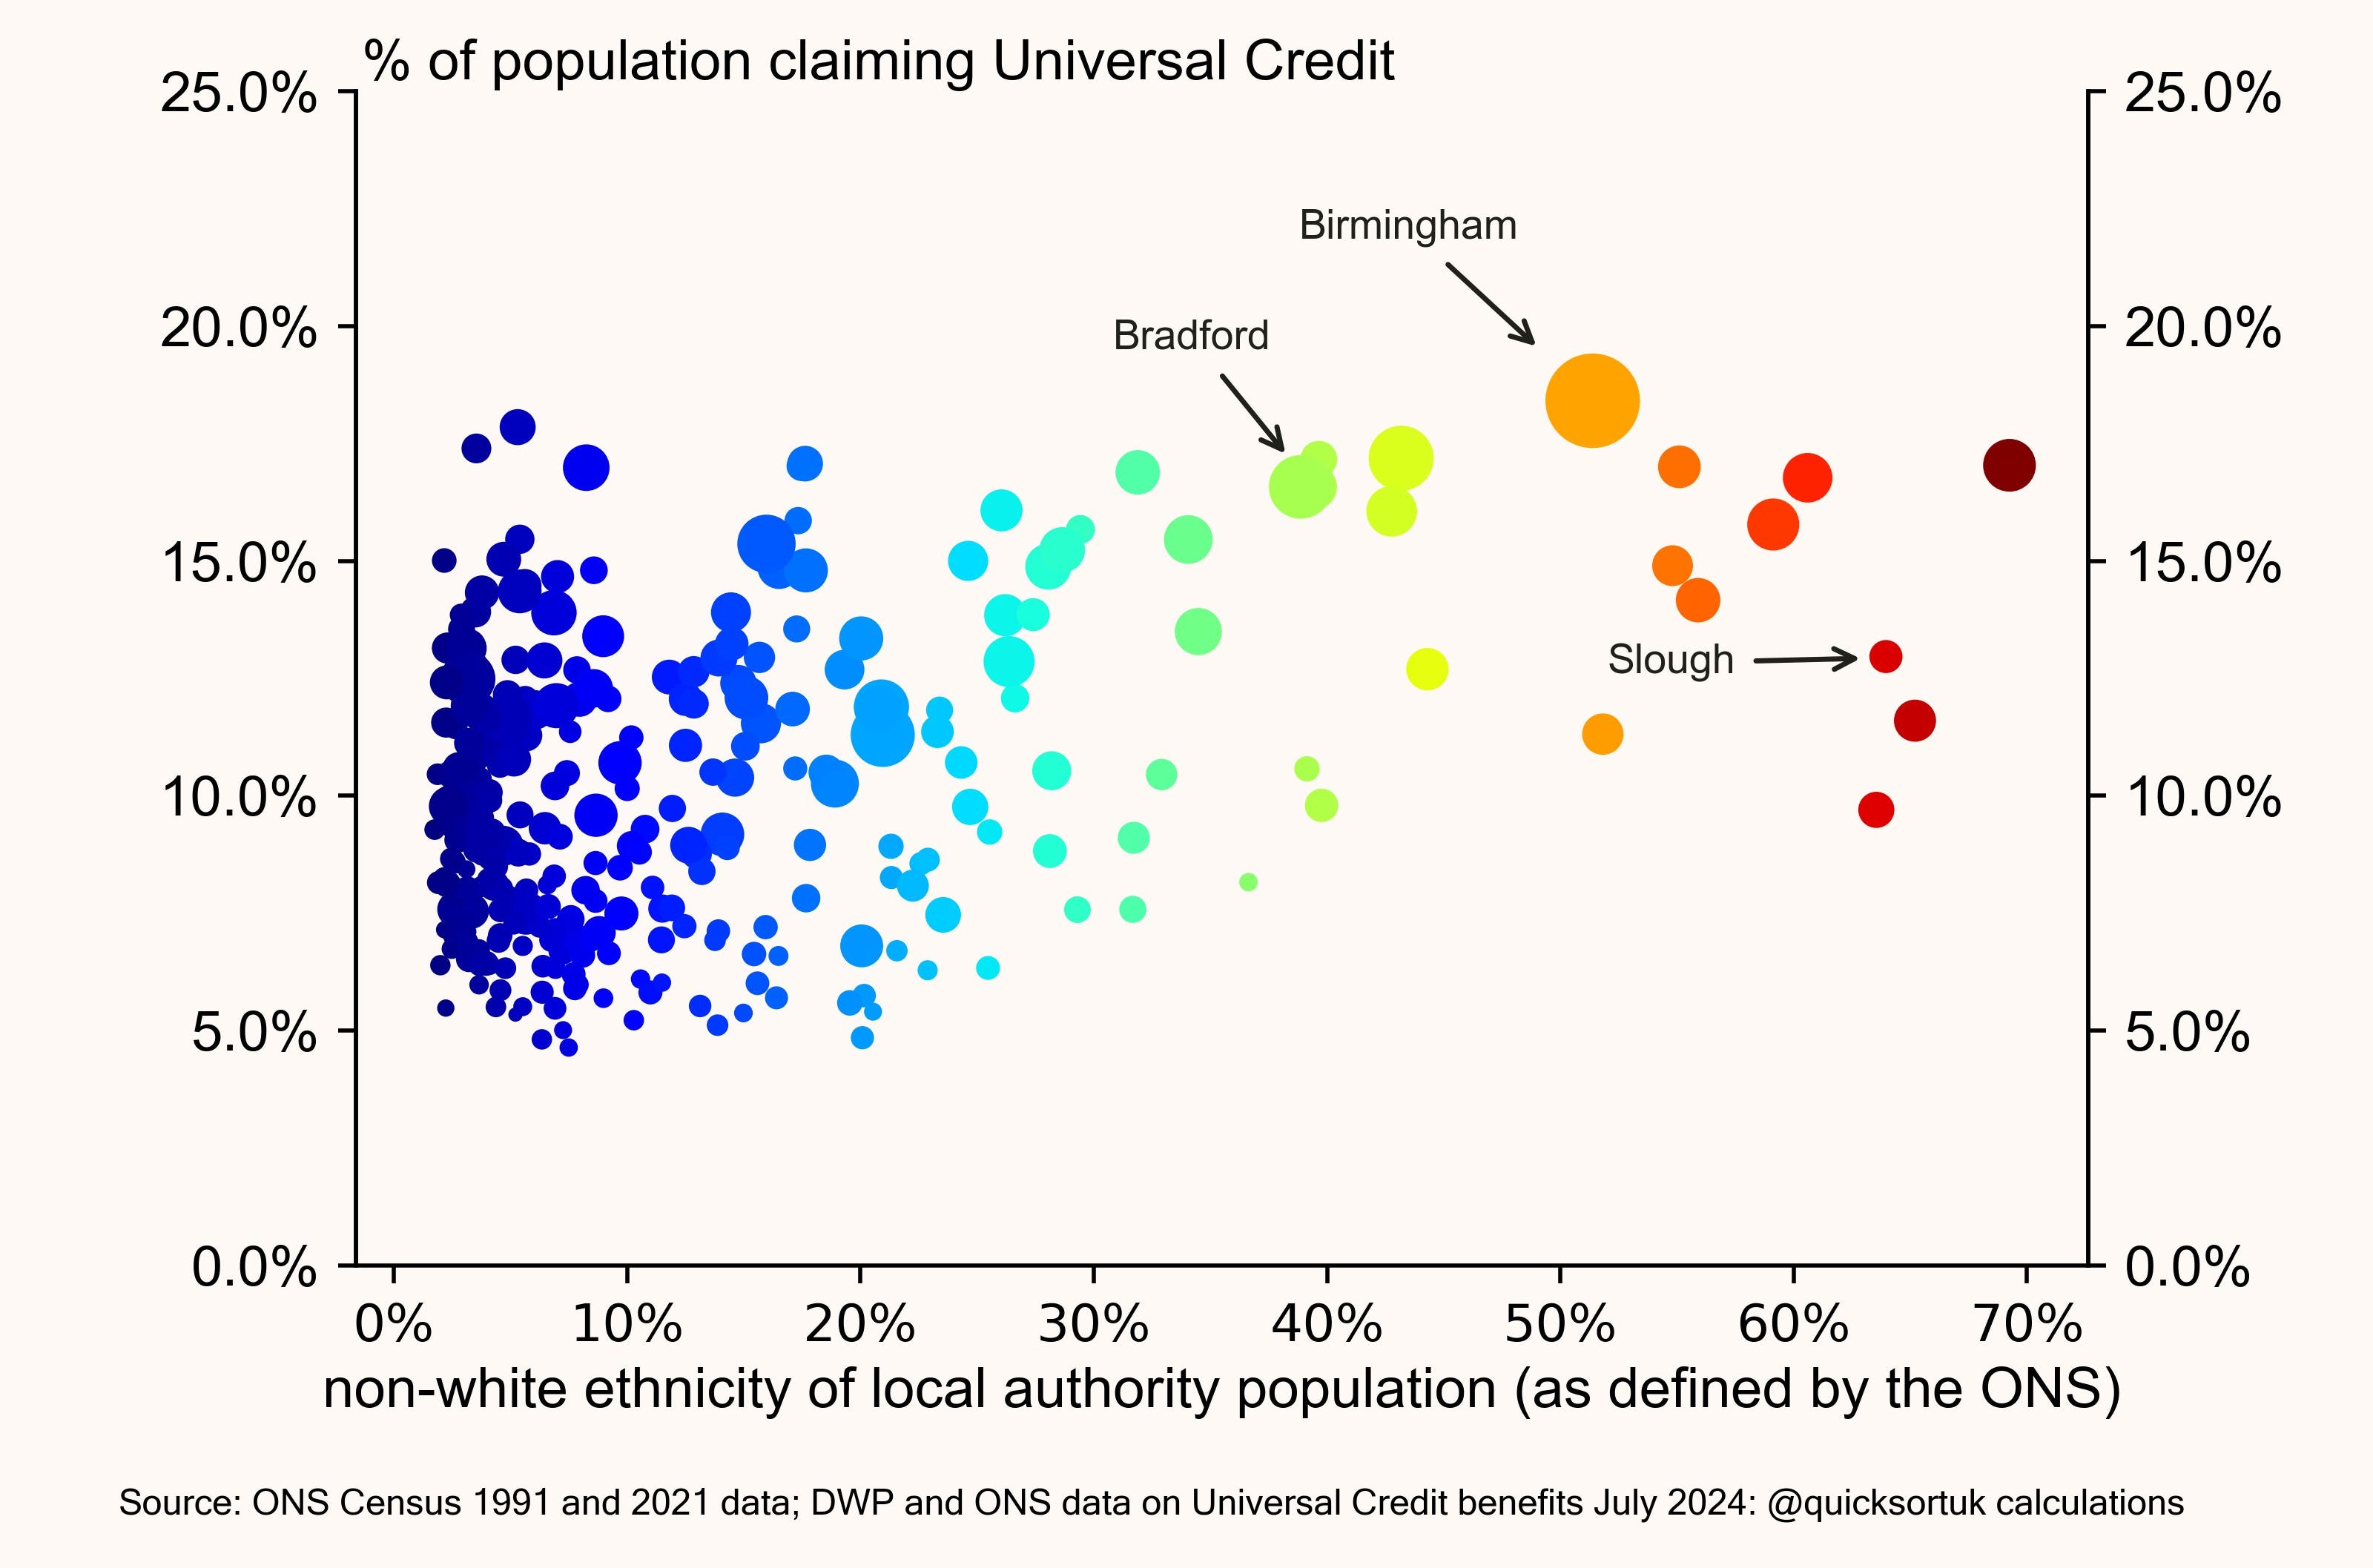
When we order councils by their ethnic minority concentration. Exhibit 3 highlights a striking effect: just 10% of the most ethnically concentrated local authorities account for approximately 25% of all Universal Credit claimants. This suggests that welfare demand is disproportionately clustered within a relatively small group of highly ethnically concentrated councils.
Exhibit 3: Cumulative Universal Credit from most ethnically diverse to least; the pink area is the ethnicity ‘deficit’ relative to zero ethnicity factor
Analysing income and benefit profiles by nationality and ethnicity
This section examines the extent to which different ethnic groups are over or under‑represented within claims data and identifies the specific areas where these disparities occur.
In Exhibit 4 we analyse Department for Work and Pensions data for a household’s primary source of income. These declarations categorise whether a family’s main income derives from regular wages, disability‑related benefits, tax credits (now largely replaced by Universal Credit), income from private investment or self‑employment. By mapping these income sources against ethnicity, we can better understand how economic circumstances vary across minority ethnic groups and how these patterns influence welfare dependency. Note: the universal credit system only had full coverage in late 2018.
Exhibit 4: Main source of income according to DWP databases; type of benefit claim by main non-white nationality/ethnicity
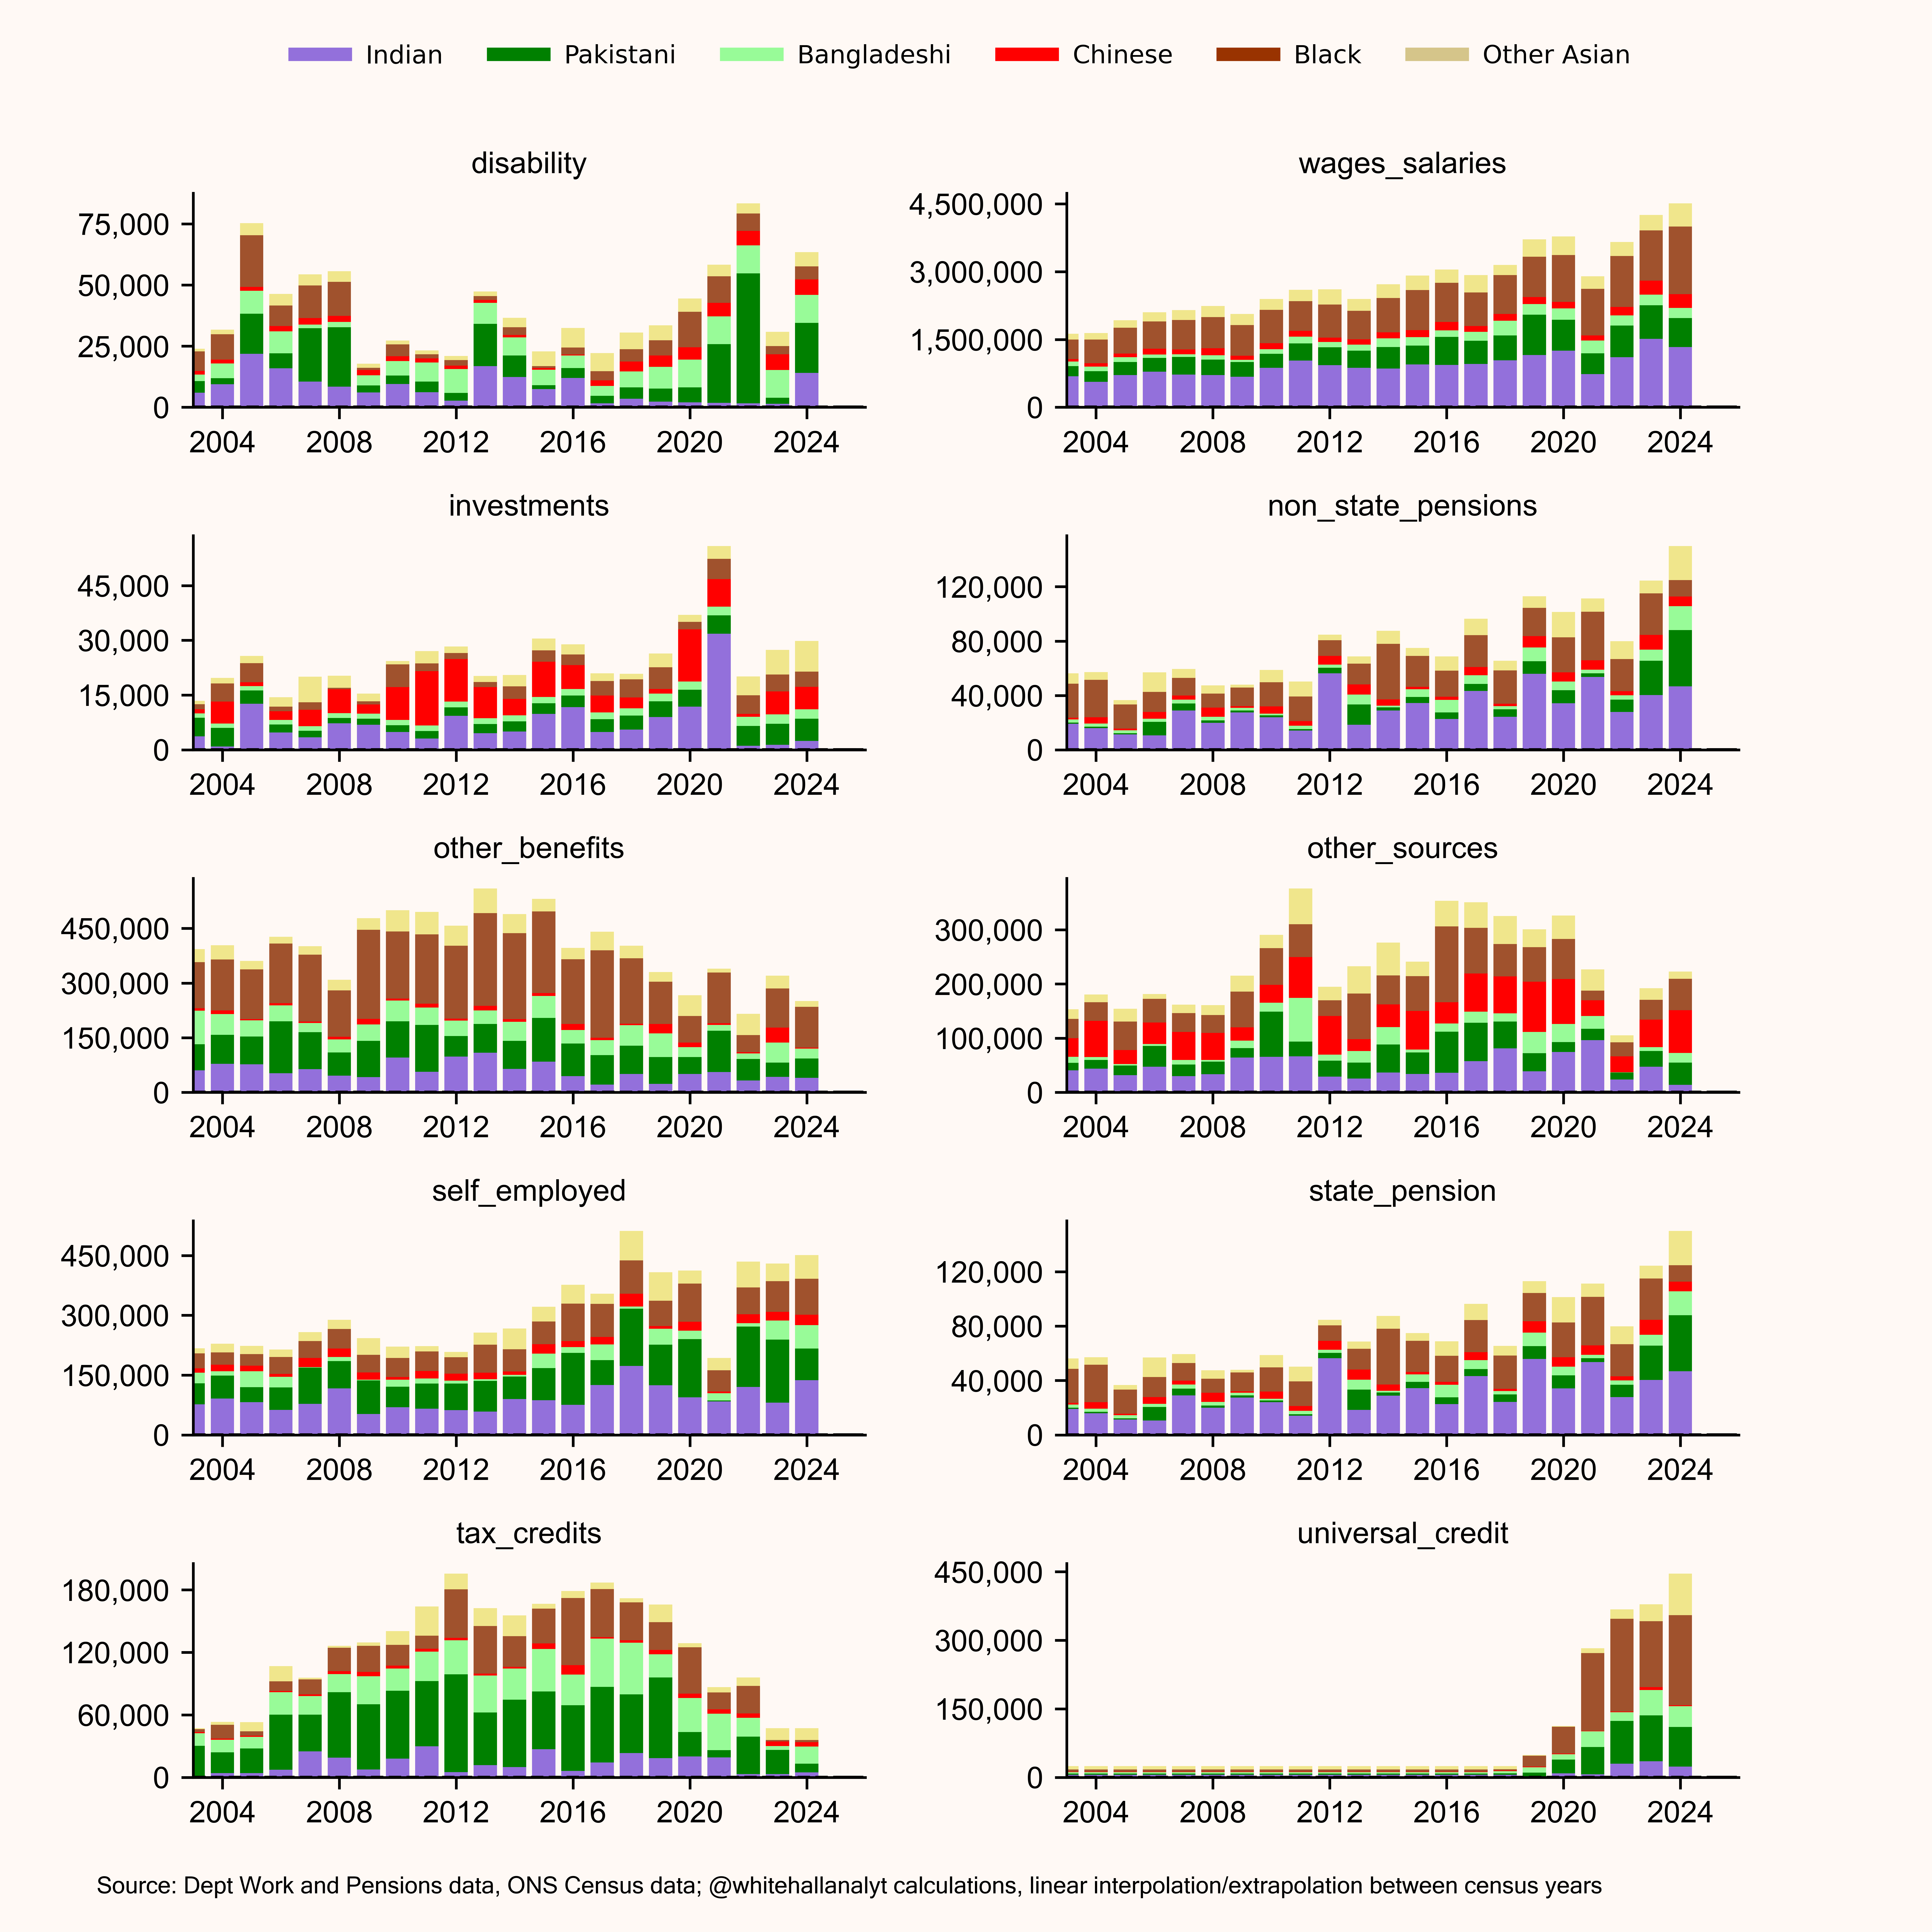
Exhibit 5: Main source of income by non-white nationality/ethnicity as % of their population weight
There are a couple of take-aways. The Pakistani and Bangladeshi communities (in dark and light green) are large recipients of benefits in the form of tax credits and universal credit. In other words, support for low incomes. The Chinese clearly have significant income from investments while the Indian communities have reasonable state and non-state pensions.
The overall pattern indicates that both the Pakistani and Bangladeshi communities experience disproportionately high levels of welfare reliance across several income‑source categories.
To help visualise these relative characteristics, we normalise the data by each group’s population share in Exhibit 5. This allows us to compare benefit and income patterns on a like‑for‑like basis.
The results show that individuals of Chinese ethnicity report income from investments and other non‑wage sources at rates approximately 2x to 5x higher than their population weight and receive low income support below their population weight. By contrast, the Pakistani community receives income‑support‑related benefits at 1.5x to 3x their population share.
Interestingly, both Pakistani and Indian groups are slightly over‑represented in self‑employment and we will return to this apparent anomaly later.
Ethno-economic clustering
In several parts of London and in a number of northern towns, settlement patterns have resulted in clusters that are predominantly Pakistani, Bangladeshi, or Indian. These areas often develop dense local business ecosystems — shops, services, and small enterprises —that are owned and operated within the community. As a result, employment networks have become locally and ethnically concentrated, with businesses tending to hire from within the same community due to shared language, cultural familiarity, or established social ties.
According to ONS data, some local areas have populations that are more than 90% non‑white, and even large authorities such as Birmingham City now have majority non‑white populations, exceeding 50%. These demographic patterns carry a range of socioeconomic implications, which are reflected in the welfare and income‑source data presented in this paper.
Remittances to Pakistan
According to research by Oxford University’s Migration Observatory the World Bank estimated Pakistan received £2.94 billion in remittances from the UK in 2021 while India sent back £4.46 billion.
A recent HM Revenue & Customs (HMRC) publication estimated that informal ‘Hawala’ networks operating between the UK and Pakistan are used to settle £2 billion of illegally laundered payments or exchange of goods each year. This figure is broadly comparable to the Migration Observatory’s annual estimate of legal remittances from the UK to Pakistan. The HMRC noted:
“Criminals are exploiting informal money transfer services in the UK to launder an estimated £2 billion annually”
It doesn’t take much imagination to suggest these networks are also being used to transfer UK social security benefits back to Pakistan. We took a different approach to Oxford and downloaded data directly from the Central Bank of Pakistan. We converted the US Dollar remittances into British Pounds and annualised the monthly figures to give an annual total remittance which we plot in Exhibit 6.
Exhibit 6: Annualised remittances to Pakistan from the UK using Central Bank of Pakistan databases
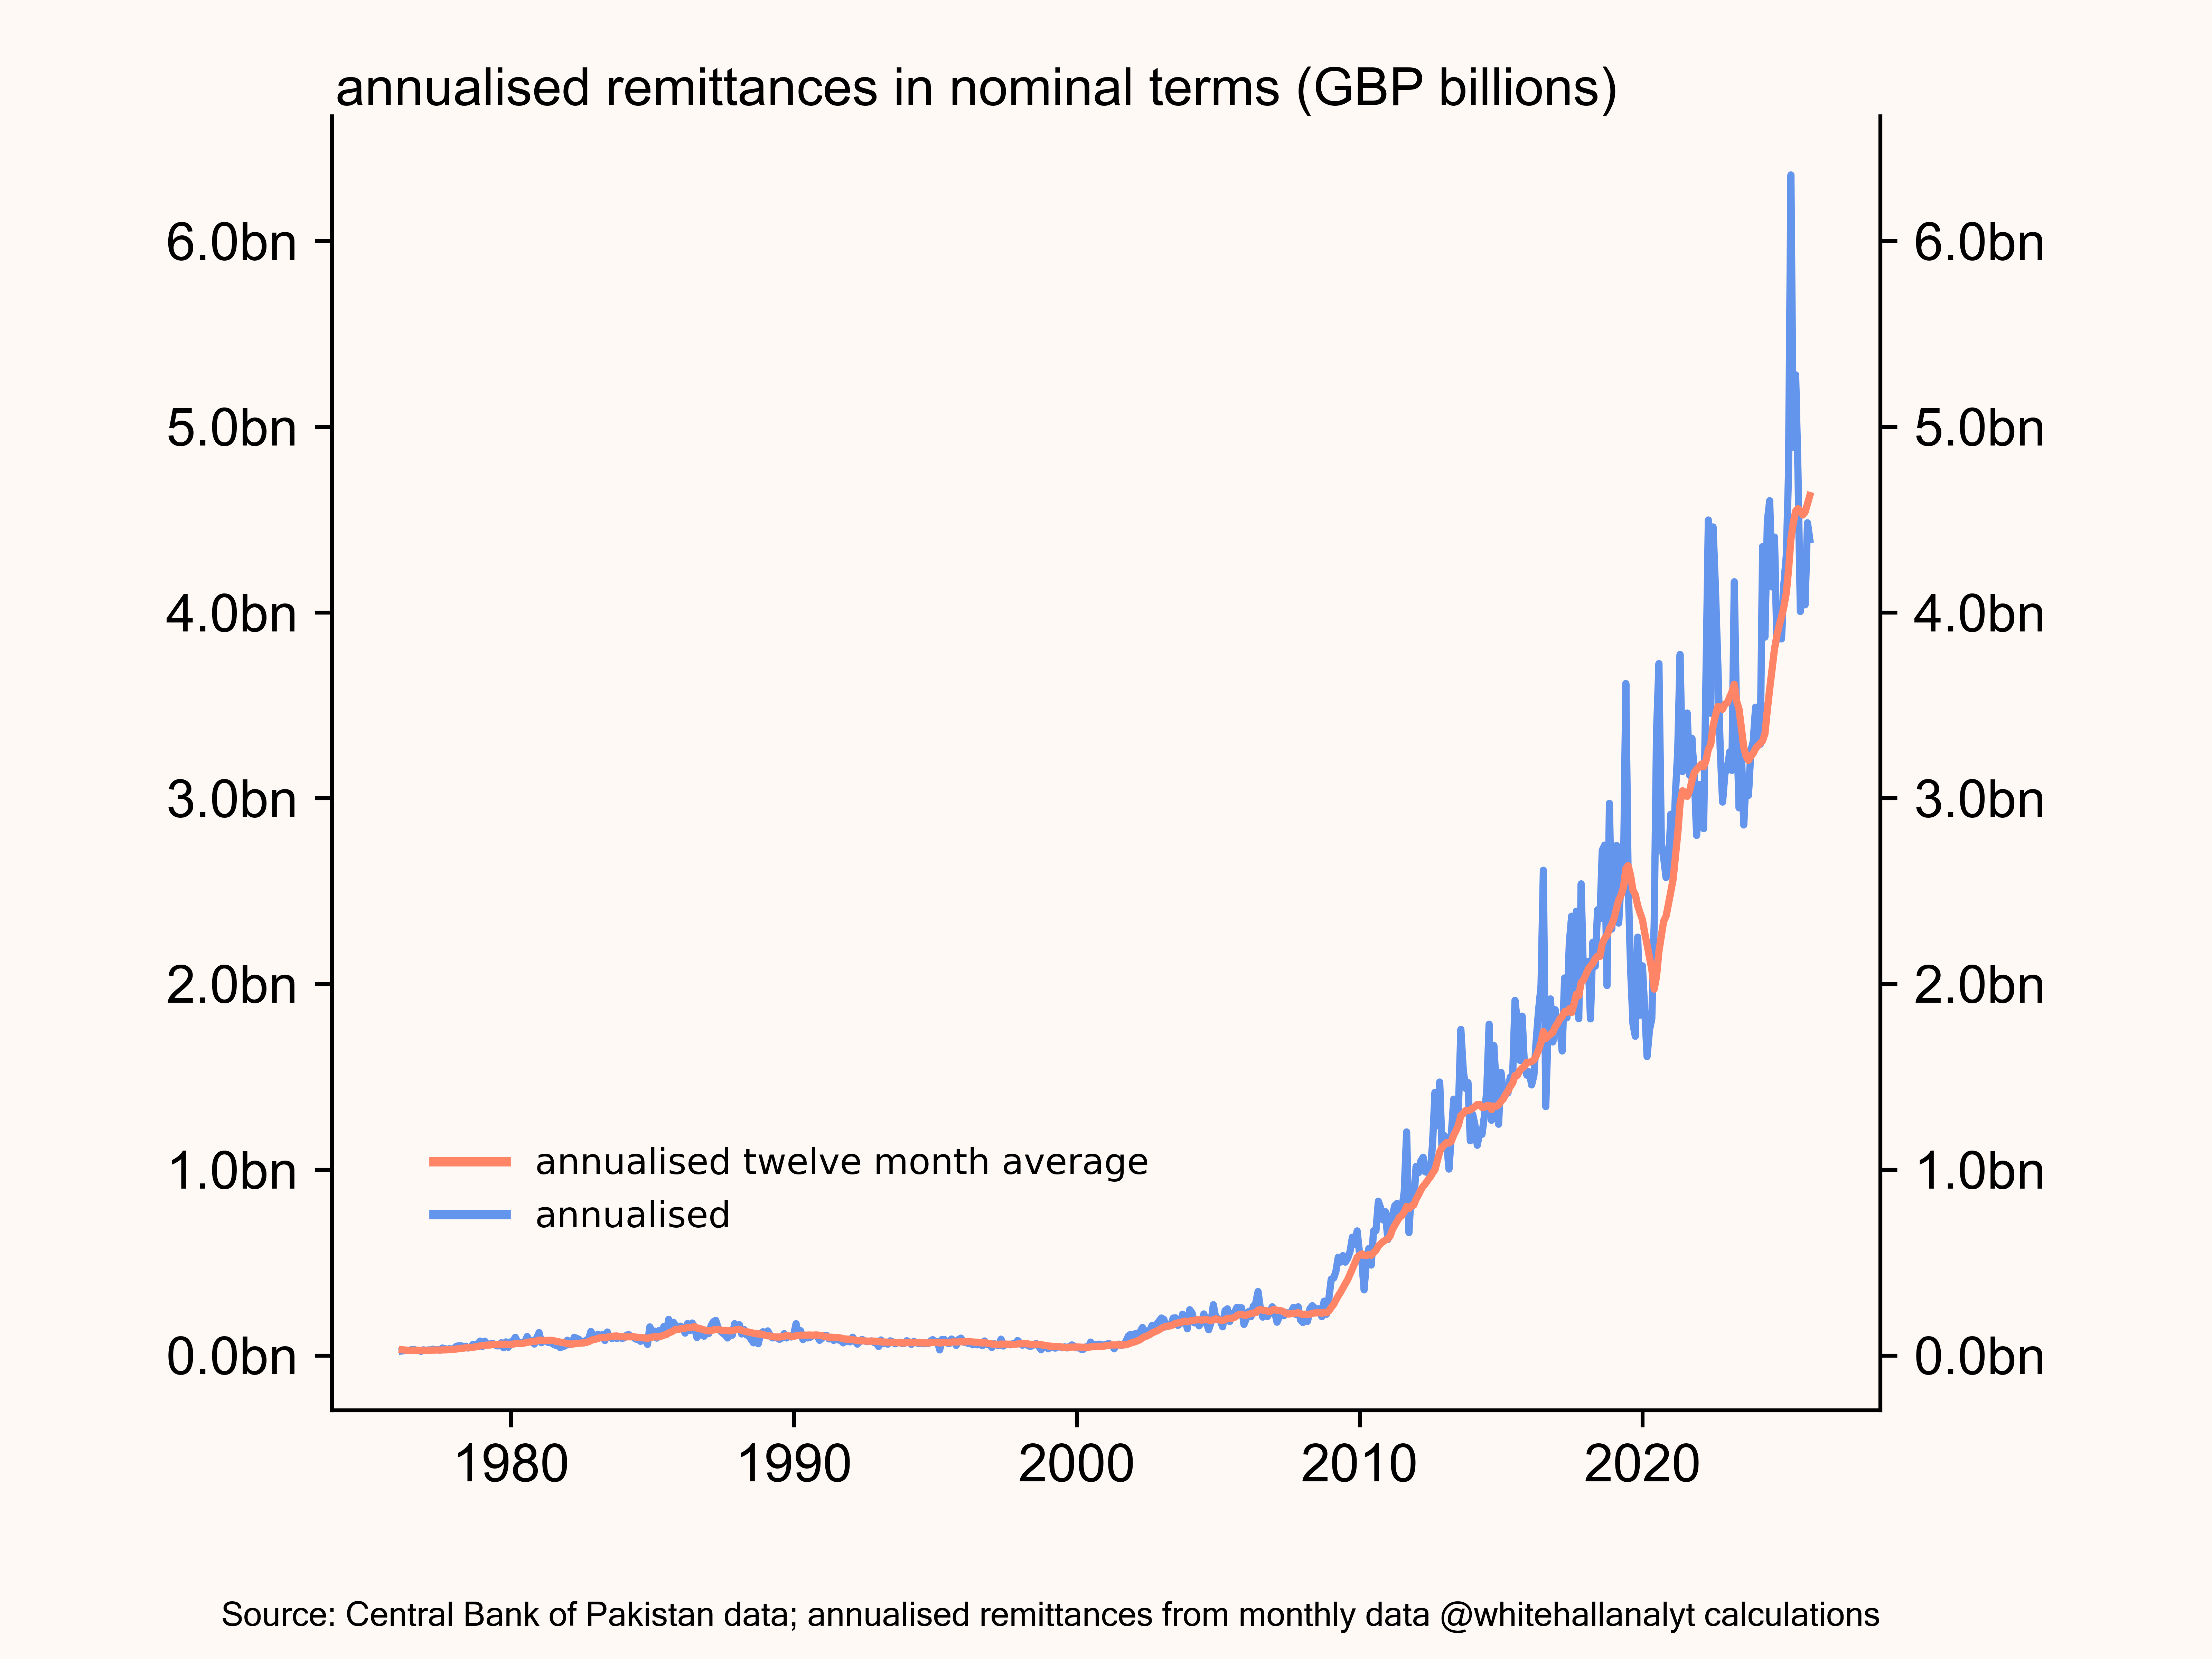
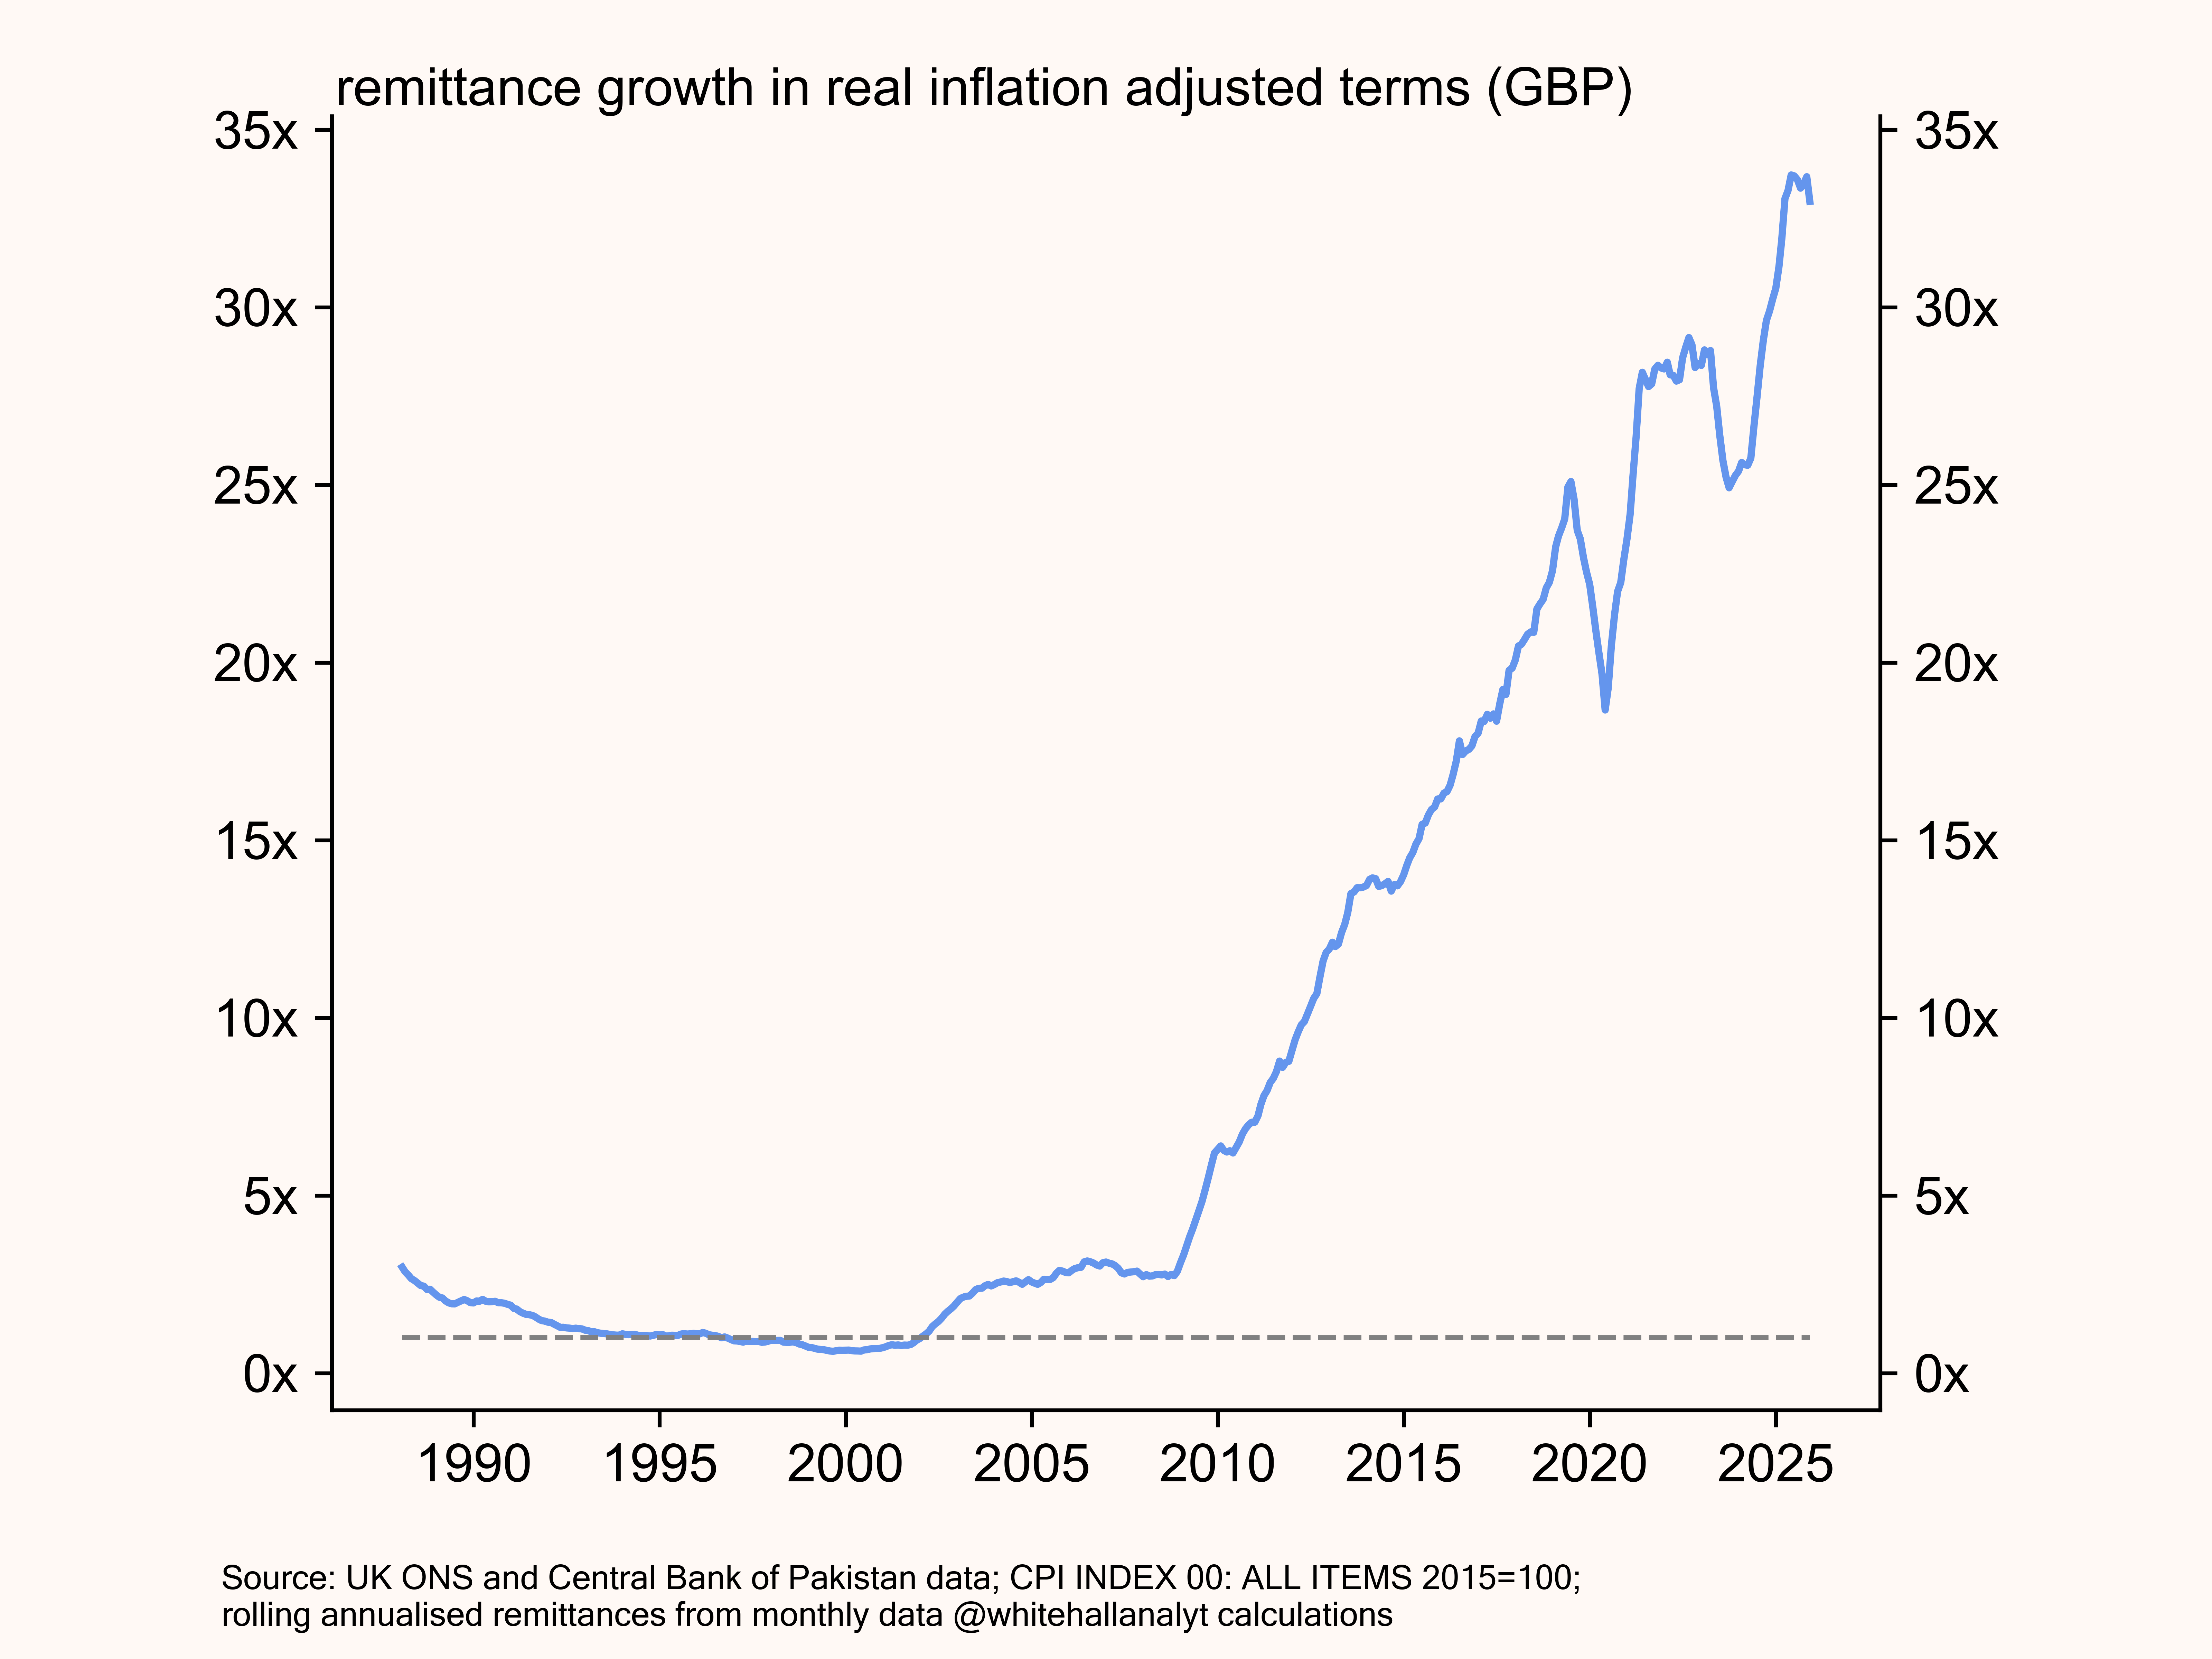
According to data from the Central Bank of Pakistan, annual remittances sent from the UK to Pakistan now run at approximately £4–5 billion annually. In real, inflation‑adjusted terms, an increase of roughly thirty‑fold since 2010 (see Exhibit 7). Over the same period, the size of the UK’s Pakistani population has grown by only around 80%, highlighting a striking divergence between population growth and the scale of financial flows at the same time as both Labour and Conservative governments allowed welfare costs to mushroom.
Exhibit 7: Inflation adjusted growth in remittances to Pakistan from the UK (derived from exhibit 6)
But this raises apparent inconsistencies which we examine later. If income‑related benefits exist to ensure a minimum standard of living in the UK and no more, why would someone still need that support if they are able to send money abroad?
A mirrored sectarian financial system?
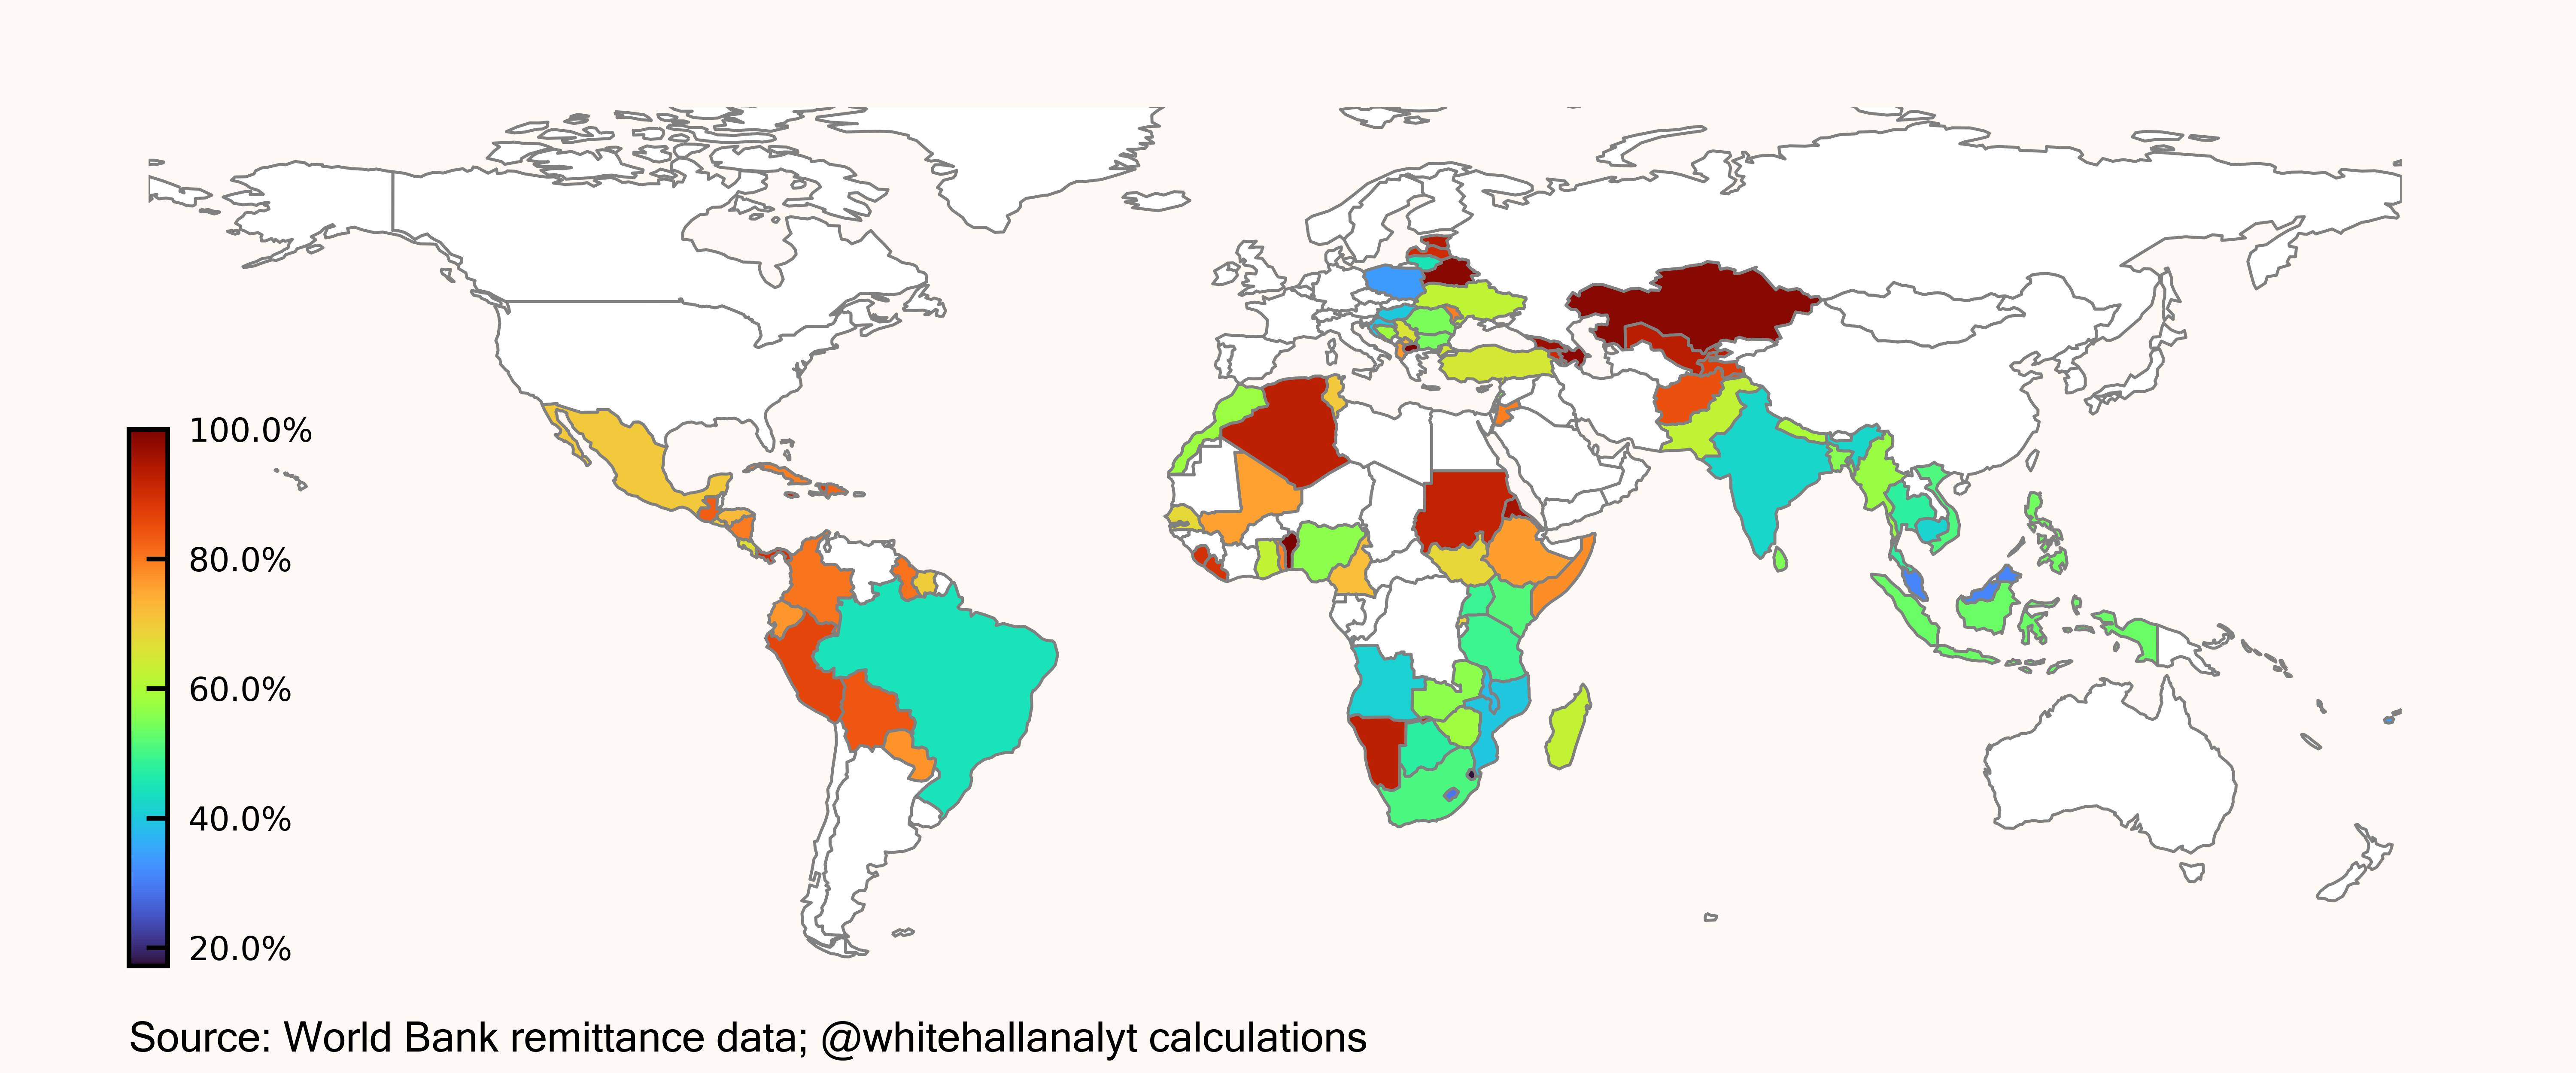
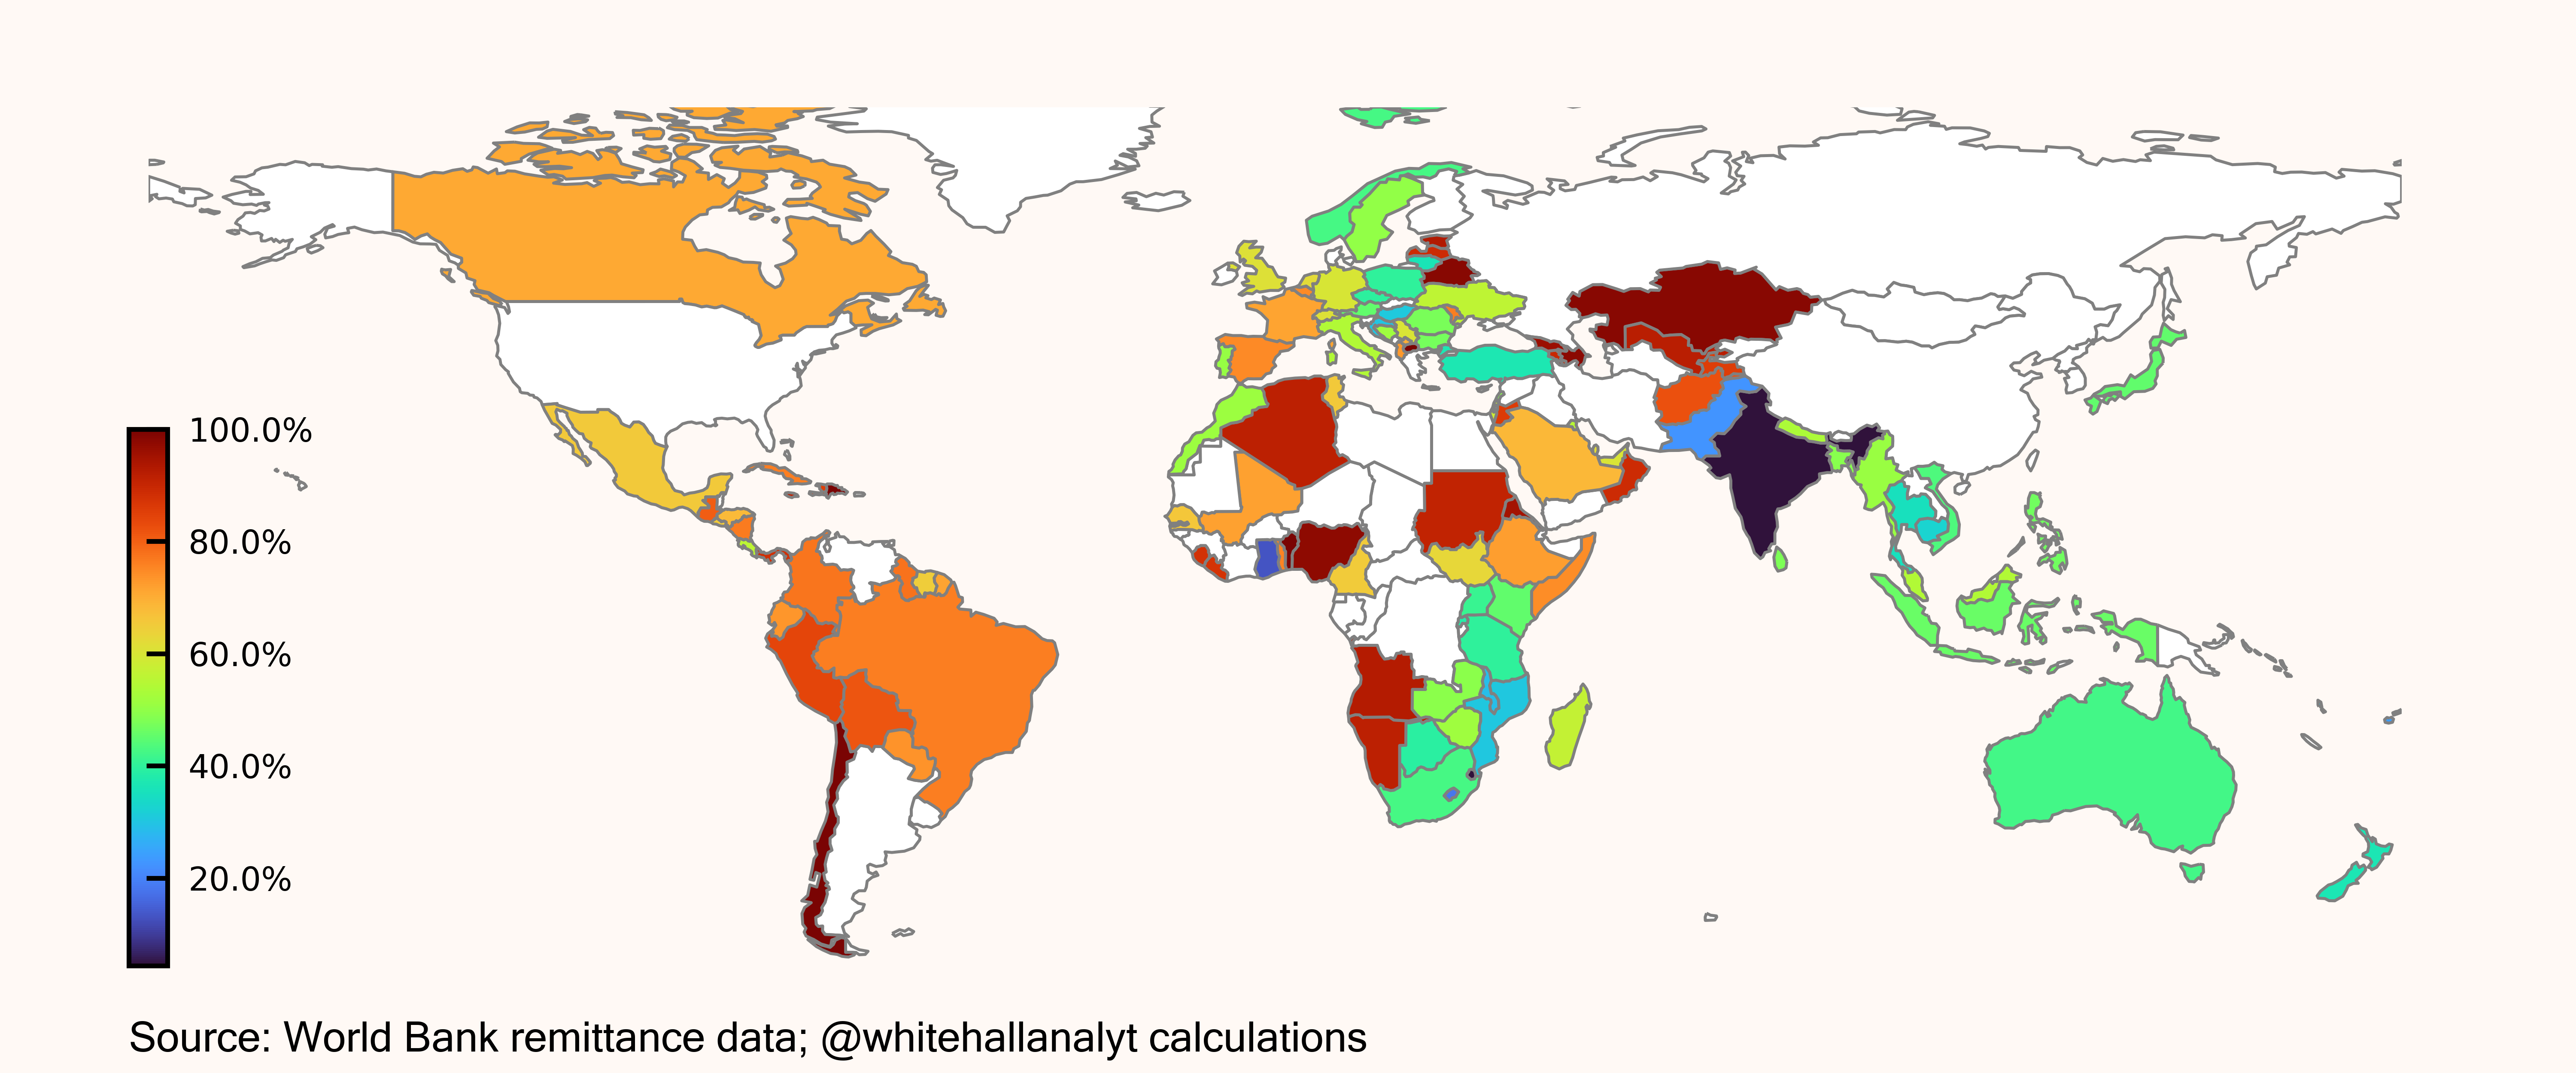
An examination of World Bank remittance data—while limited in scope — indicates that approximately 60% of remittances from the UK to Pakistan are made in cash; although the World Bank data-set is only a snapshot of the total transaction volume. A significant share of these transactions is believed to move through Hawala networks, a trust‑based informal transfer system that operates via brokers who settle payments outside the formal banking sector. These networks rely heavily on cash‑based exchanges and parallel bookkeeping rather than regulated financial channels. - see our mapping of World Bank data in Exhibit 8 for an understanding of global characteristics.
Exhibit 8 (a & b): Pakistan remittance transactions from the UK are in cash 60% of the time from source (top) to destination (bottom). This has been consistently the case for the past twenty years
Several towns in the North of England have experienced the emergence of locally concentrated political dynamics shaped by long‑standing migration patterns originating from regions such as Mirpur in Pakistan. What began as localised community‑based political mobilisation within councils has, in some areas, evolved into the election of independent Muslim parliamentarians. These representatives often prioritise international issues that resonate strongly with their constituencies who identify with Pakistani or Bangladeshi heritage.
Entire communities live their lives as microcosms of the Indian sub-continent. Many have dual citizenship and through cultural osmosis have imported cultural and financial practices from Karachi and elsewhere.
We suggest that the emergence of highly localised political dynamics in some towns has been accompanied by the development of equally localised financial and business ecosystems.
These networks can operate with limited transparency and weak regulatory oversight, creating conditions in which tax evasion, benefit fraud, and illicit financial transfers may occur easily. Such practices mirror parts of Pakistan’s economy, where unregulated cash‑based systems and trust‑based financial networks remain widespread.
The growth of economically insular local markets — where businesses, labour, and capital circulate largely within a single community — can make regulatory scrutiny more difficult. We suggest that enforcement bodies, including the HMRC and DWP, may at times be hesitant to investigate specific areas or networks due to concerns about community relations or sensitivities.
Inconsistent work and benefits data?
Earlier exhibits suggested the Pakistani community was heavily over-represented in terms of disability and employment benefits. But here is the question:
If the Pakistani community (and others for that matter) have low incomes and the UK benefit system is there to maintain basic standard of living thresholds how do we explain the 30x increase in remittances since 2010?
Furthermore, what is the economic genesis of the remittances? By definition it must be work, investment income or recycled benefits that they don’t really need.
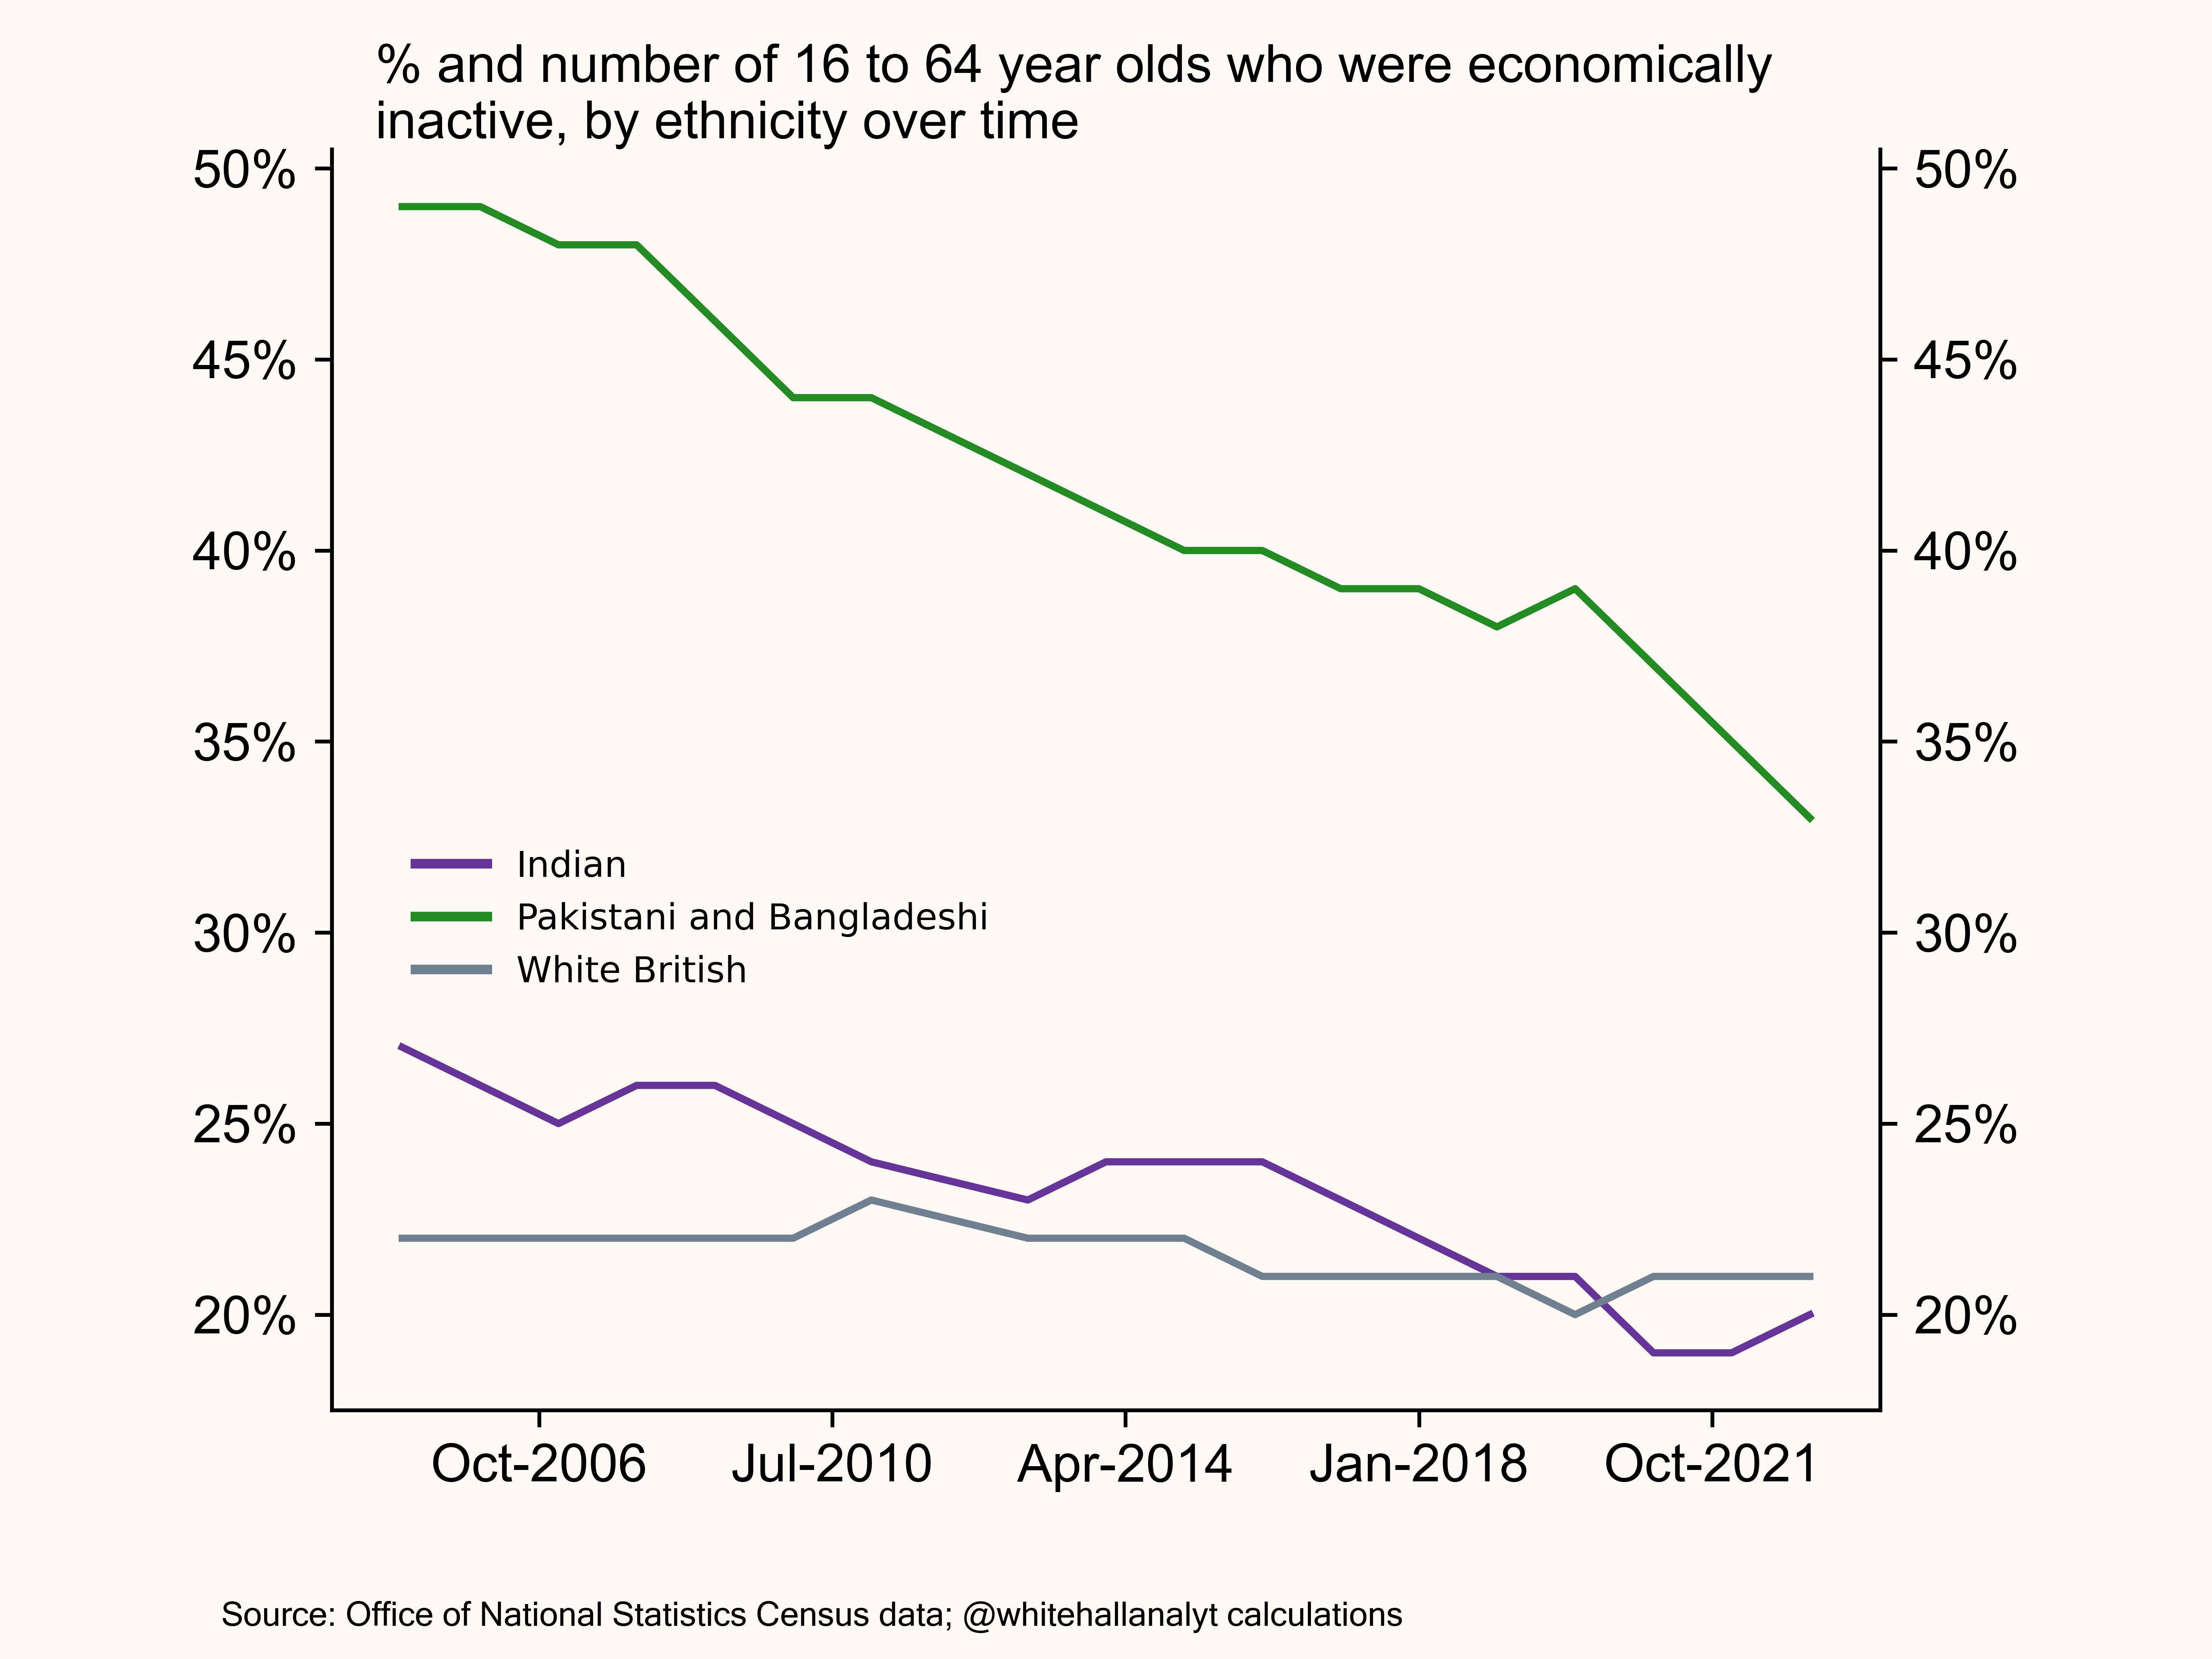
The Pakistani community have roughly 80% more economic inactivity relative to Indian or White British groupings (see Exhibit 9). They are, as we saw earlier, disproportionately claiming disability and income support let alone housing benefit as well. But if they can afford to send money back to Pakistan does it imply out of work or low income benefit claims that are overstated by an opaque sectarian economic block based in imported culture and practices from Pakistan?
Exhibit 9: Department of Work and Pensions data on economic inactivity for Pakistani ethnicity
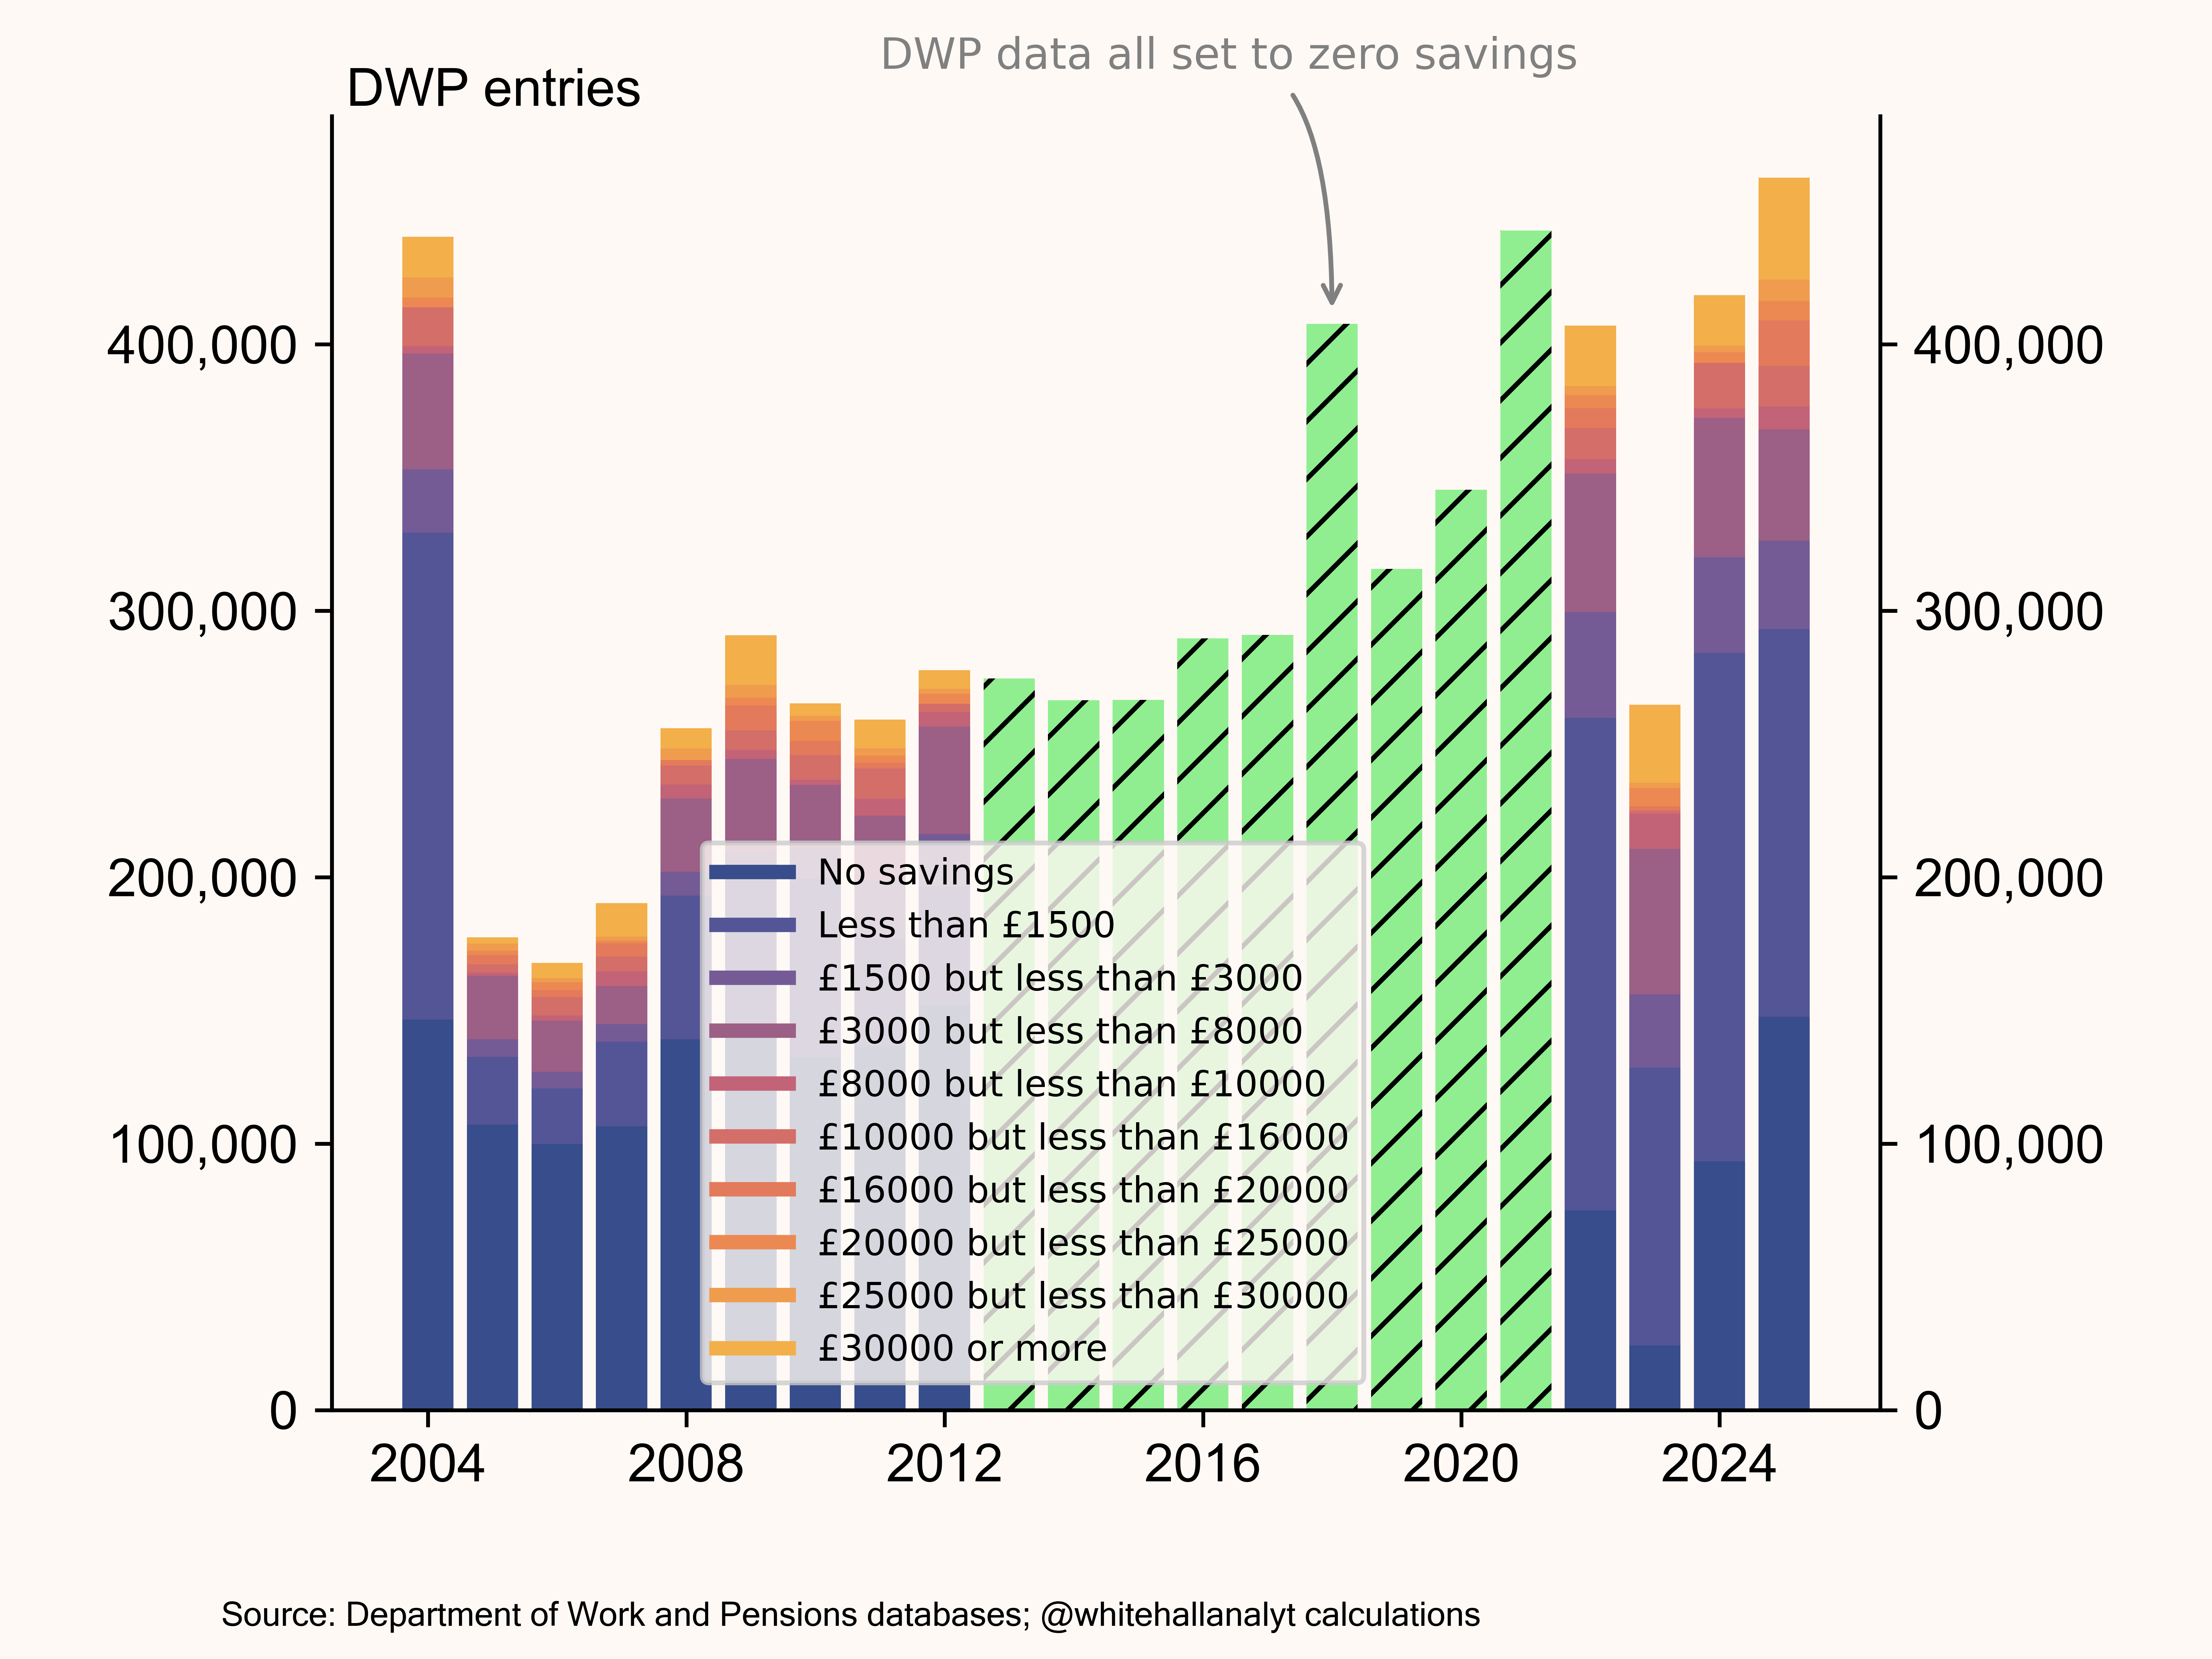
Further still, according to the DWP the majority appear to have zero or very low savings (Exhibit 10) as were their levels of investment income shown in earlier Exhibits 4 & 5. So they can’t be sending investment income home because they don’t have any or is it being hidden in a parallel financial system?
Exhibit 10:Savings bands for Pakistani ethnicity -Department of Work and Pensions data
But perversely, and in tune with our premise of mono-culture sectarian economic blocks, they have had up to 50% more people listed as self-employed relative to all other ethnicities (see Exhibit 11). But if they have no savings and are on benefits how are they more likely to be self-employed?
Exhibit 11: Self-employment status for Pakistani ethnicity - Department of Work and Pensions data
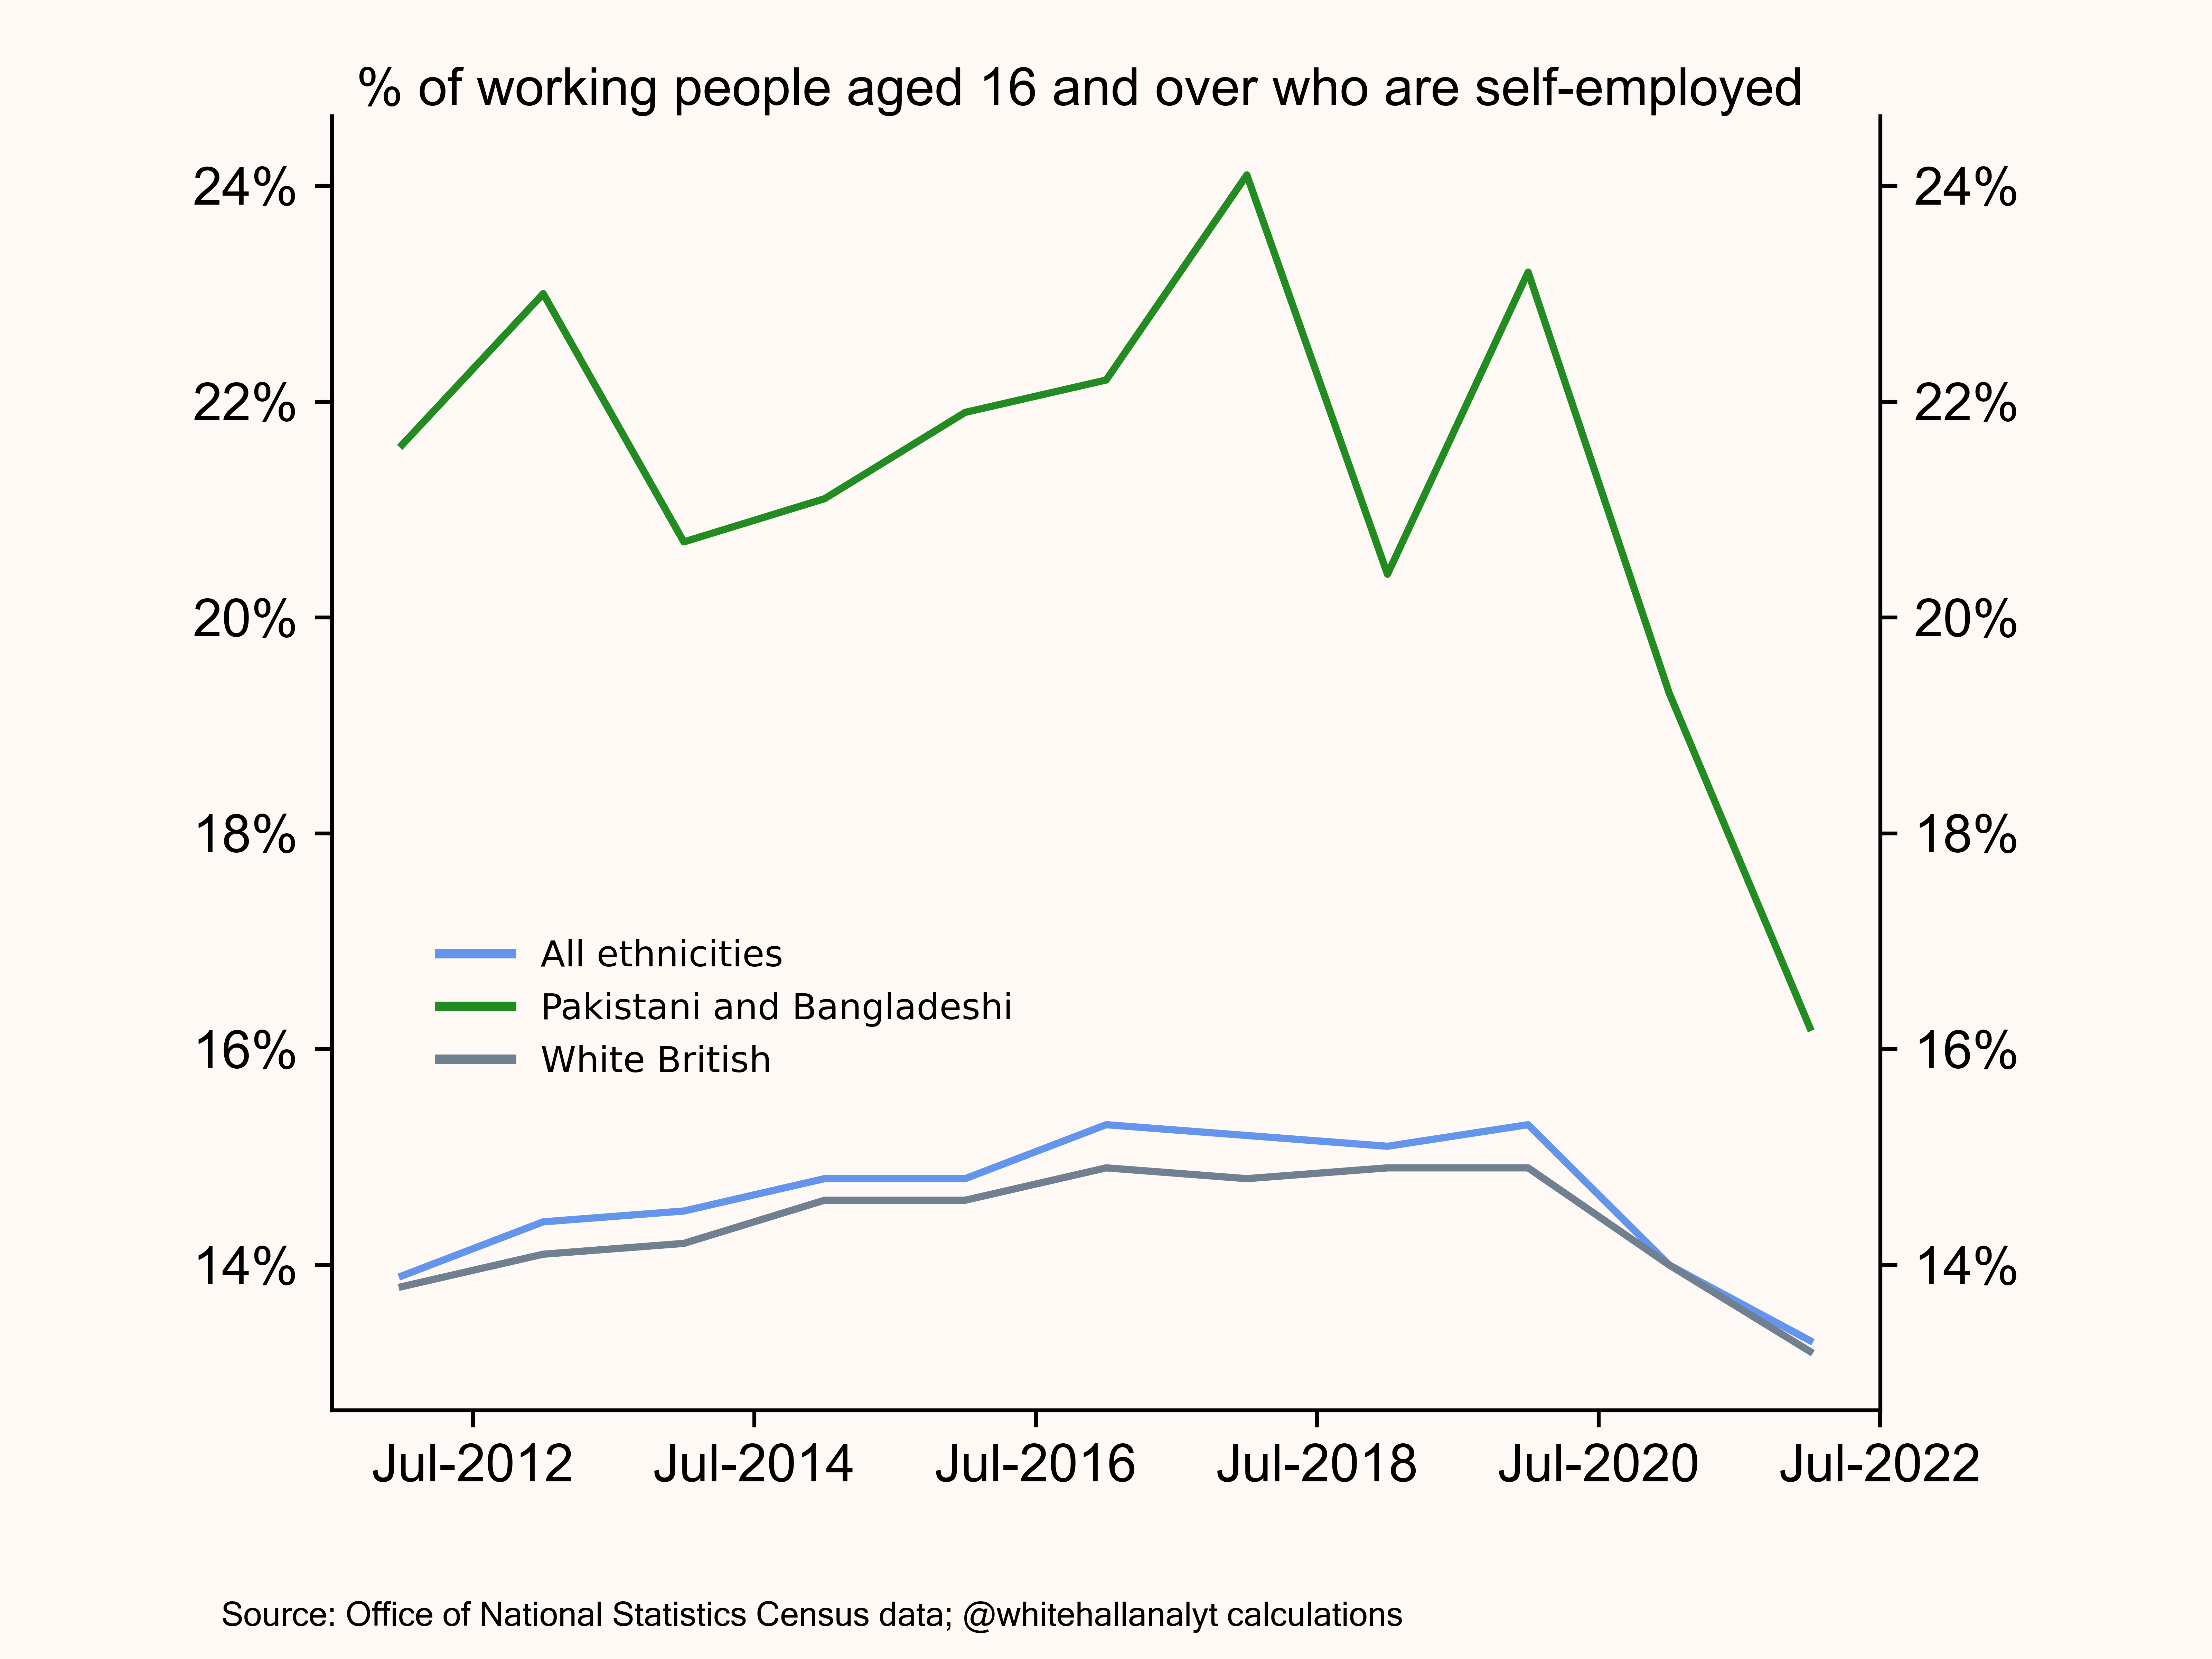
But of course, being self-employed means you submit your own hours and expenses outside of PAYE.
With the rise of sectarian politics in some of our towns and cities we also premise a parallel rise in what we term ‘sectarian economics’. The UK has imported Indian sub-continental attitudes that are inconsistent with transparency and honesty regarding the HMRC and a welfare support system. A system many members of Pakistani communities regard as quasi-foreign and there to be exploited, fund and support tribal alliances back in Pakistan.
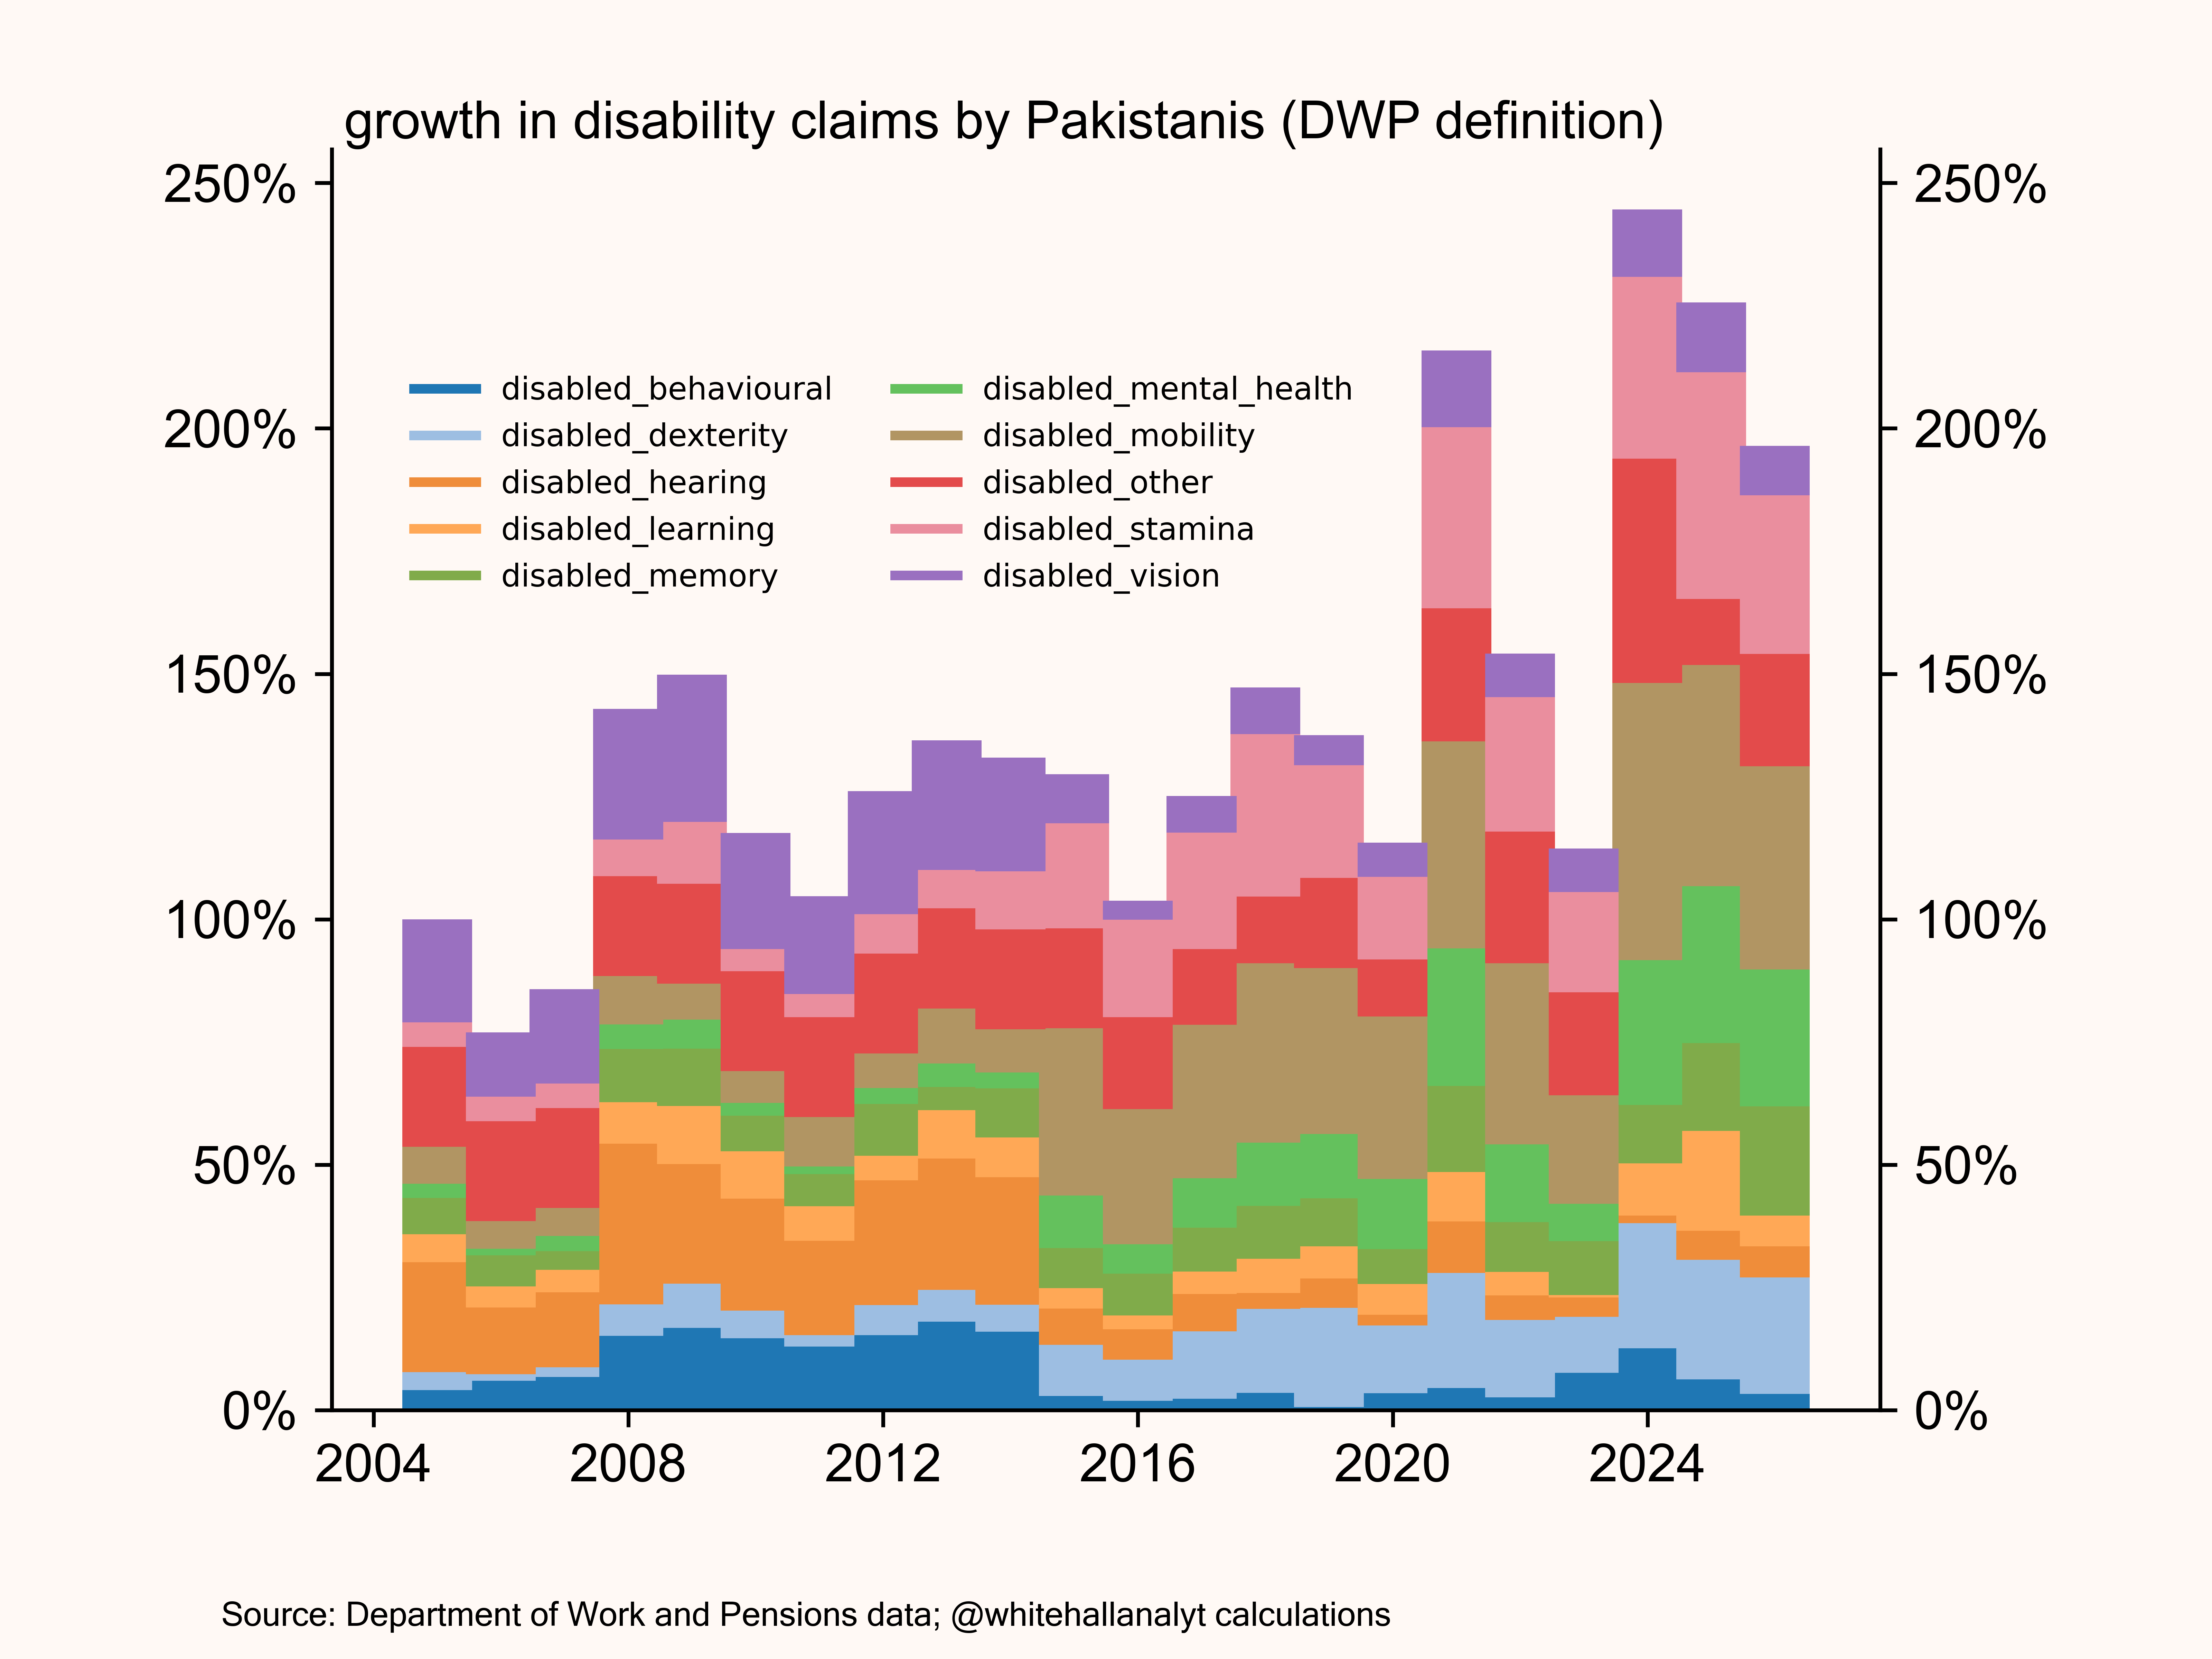
We suspect, and this is unfortunately true of all ethnicities, to a greater or lesser extent, including White-British, there has been significant gaming of disability claims.
Exhibit 12 raises concerns about the pattern of disability claims in the Pakistani community. Why? Because the reallocation of disability type over time is more volatile than total claims which implies claim type ‘switching’. For example, from 2016 on-wards we see mobility claims taking over as a replacement for hearing and learning difficulties.
Exhibit 12: Pakistani claim by disability type over time according to Department of Work and Pensions data
Further policy discussion points
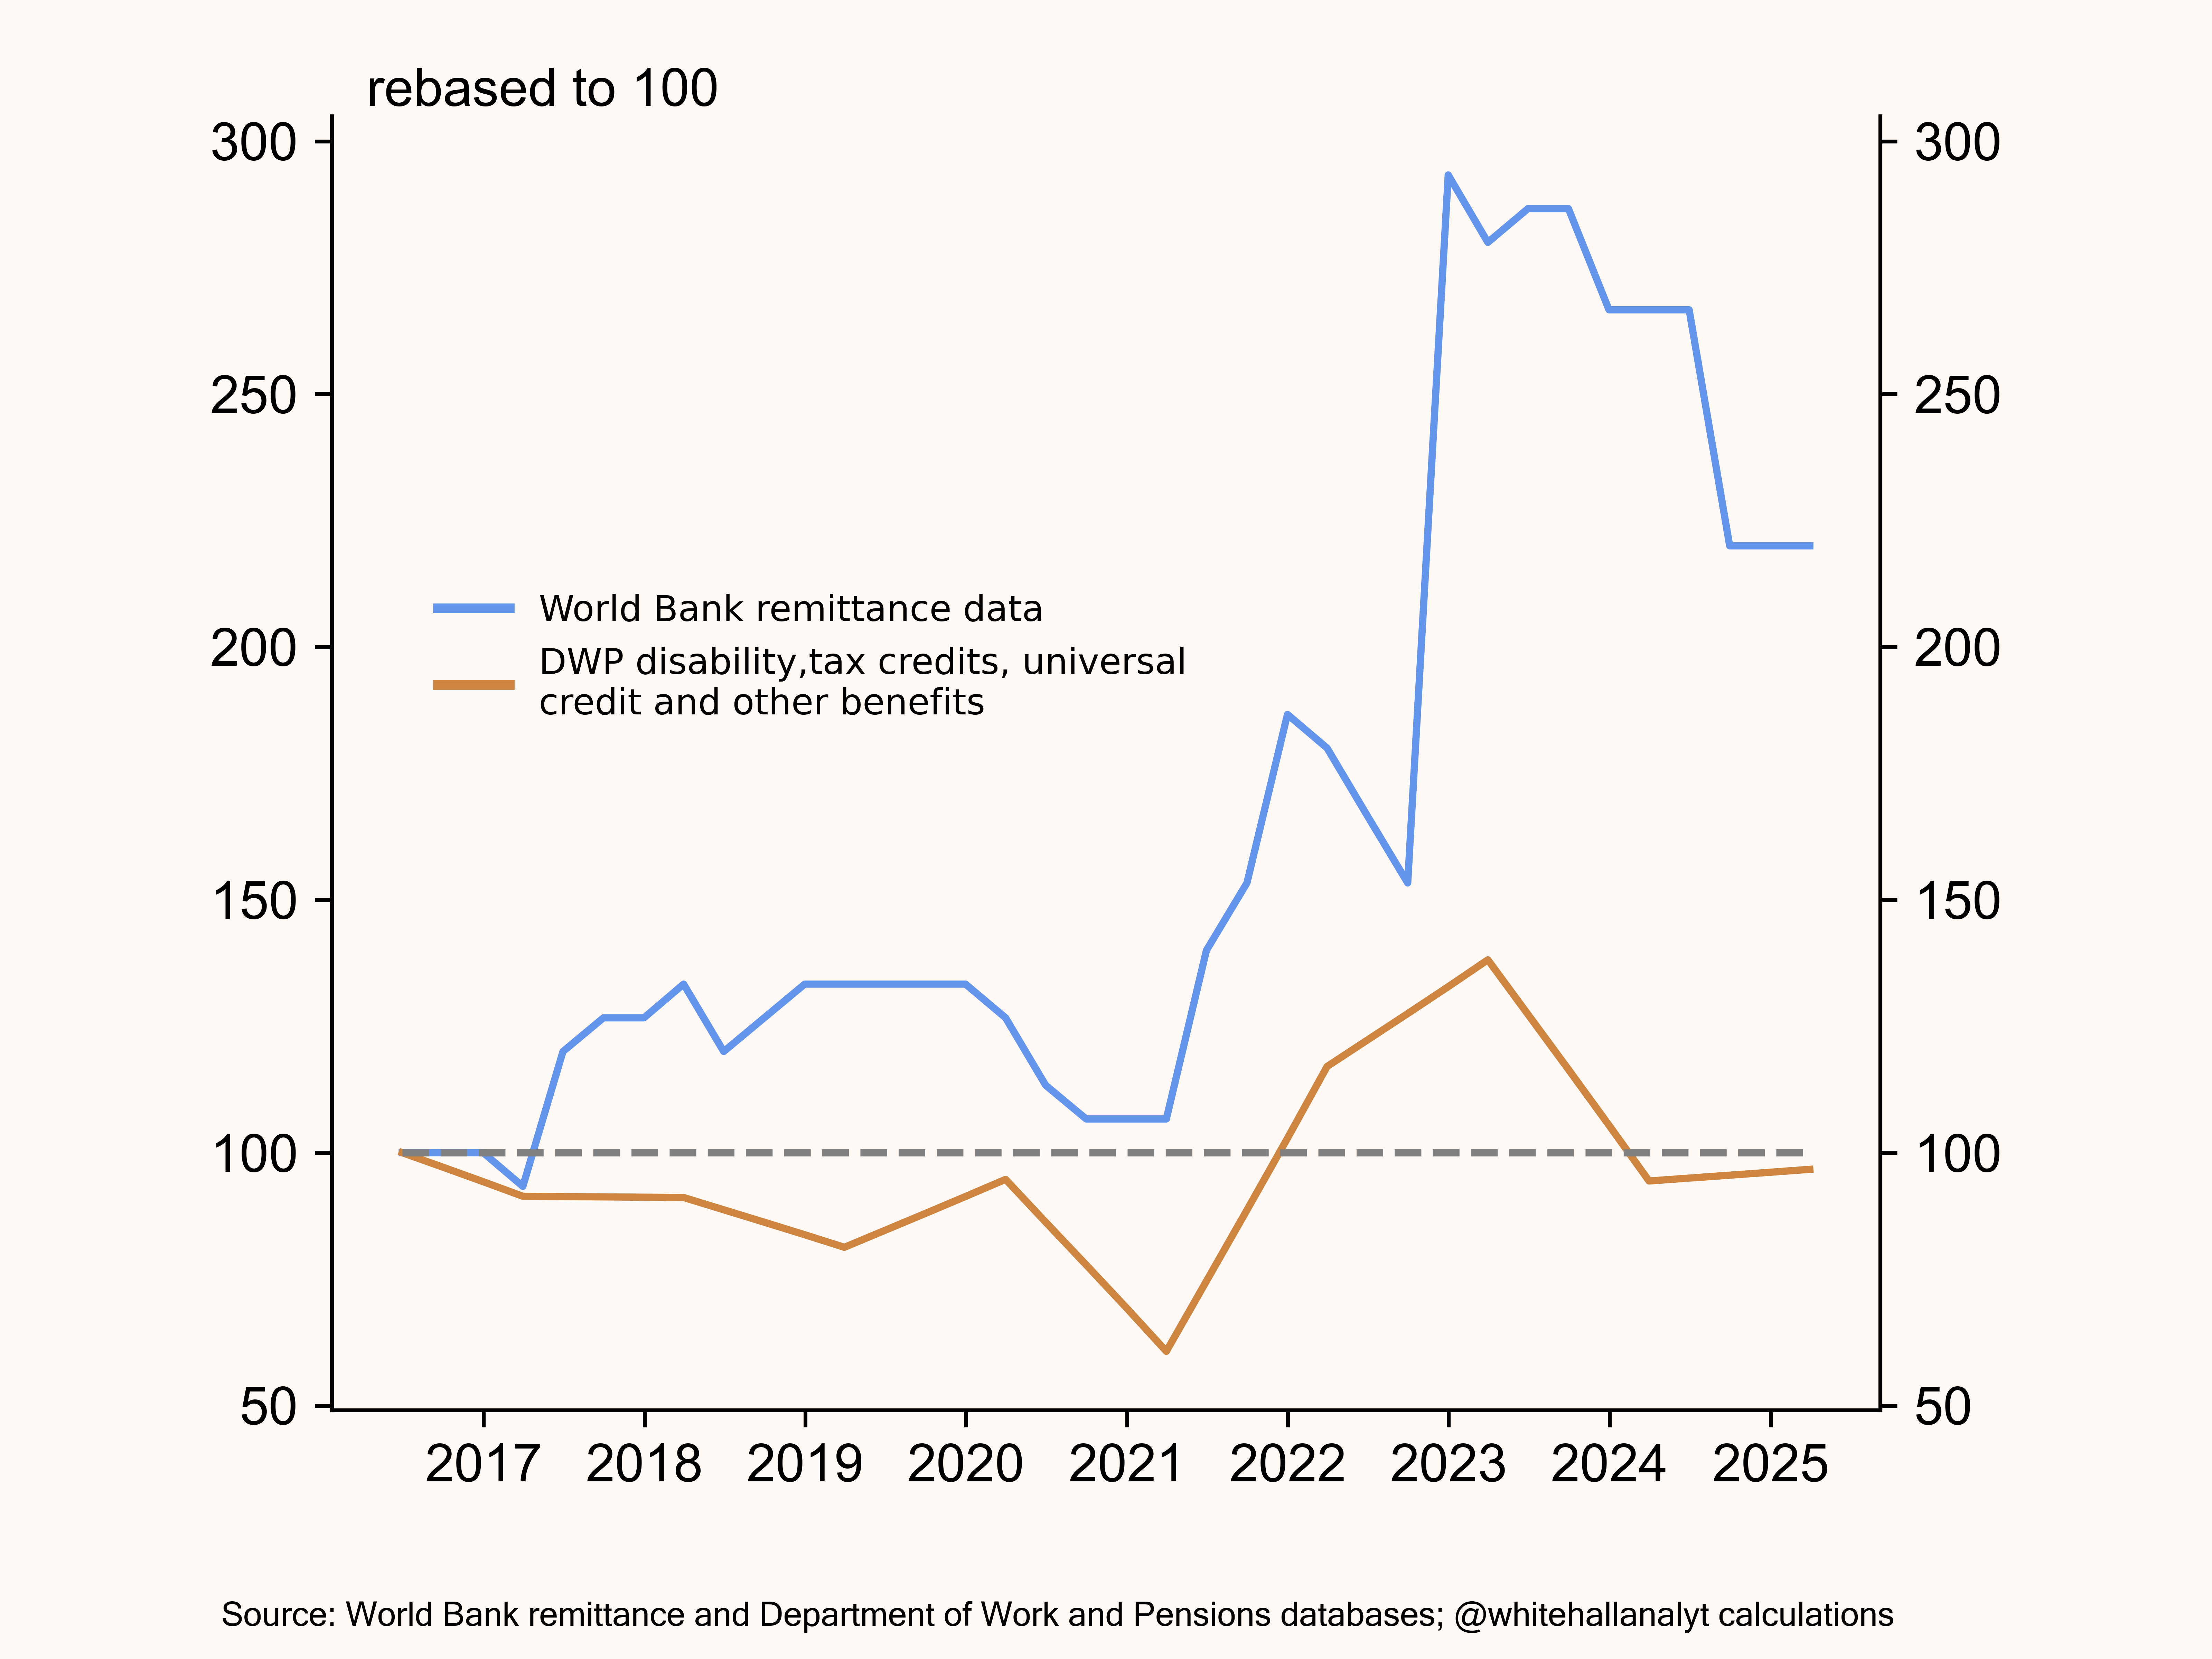
There is much for further discussion but we end with Exhibit 13 where we try to correlate World Bank remittance data with benefits paid to Pakistanis in the UK. It will never be perfect, for a host of reporting reasons, but the general shape of the declines and uplifts infer a structural relationship that needs further focus.
Given the data and the scale of the remittances it is not unreasonable for the Pakistani community to be asked to explain how £4-5 billion a year is flowing back to Pakistan when their community is disproportionately on income support, benefits and with little or no savings. While at the same time seeming to have higher self-employment rates than others.
Exhibit 13: Department of Work and Pensions data on disability, tax credit and universal credit benefits and remittance data from World Bank database
From a policy perspective the UK cannot afford to continue with a financial free-for-all that racks up ever increasing debt and taxes on a diminishing private sector.
Whitehall Analytics
23rd December 2025